Digital Gauges vs Mechanical Gauges in Heavy Machinery: A Technical Comparison
Introduction: Why the Gauge Choice Is Really a System Design Choice
A few years ago, I spent an afternoon in a hydraulic system test cell comparing readings from a legacy mechanical Bourdon tube pressure gauge and a digital pressure transducer connected to a display module, both measuring the same hydraulic circuit simultaneously. The mechanical gauge was reading 3.8 bar when the transducer was showing 3.6 bar. The transducer was right. We confirmed it with a calibrated reference. The mechanical gauge, which had been in service for eleven years, had developed a calibration error of approximately five percent.
The facility maintenance team was surprised. The gauge looked fine. The needle moved smoothly. No one had flagged it as a problem. It had simply drifted, as mechanical gauges do, without any visible indication that its readings were no longer accurate.
That afternoon crystallized something I had seen across many heavy machinery applications: the choice between digital and mechanical gauges is not really a choice between display technologies. It is a choice between measurement philosophies. Mechanical gauges are direct-reading devices that convert physical force into mechanical movement. Digital gauges are signal processing chains that convert physical measurements into digital values, process them, and render them on a display. Each approach has distinct accuracy, reliability, integration, and lifecycle characteristics that make one or the other more appropriate depending on the application.
This post covers both technologies honestly, including their respective limitations, and provides the comparison framework that should drive gauge selection decisions in heavy machinery applications.
How Mechanical Gauges Work and Their Inherent Limitations
Understanding the mechanical gauge’s strengths and weaknesses starts with understanding its operating principle. The most common mechanical gauges used in heavy machinery fall into three categories.
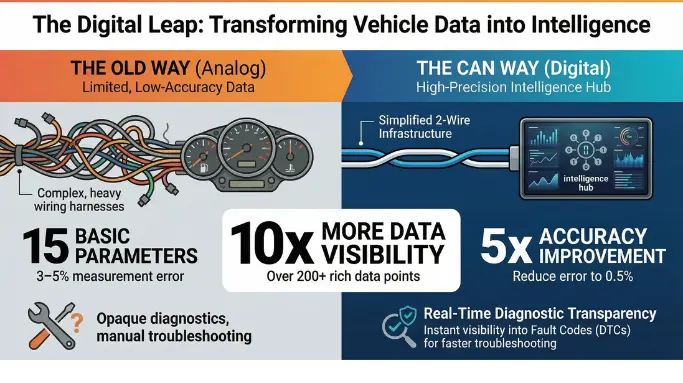
Bourdon tube pressure gauges: A curved metal tube sealed at one end. When pressure is applied to the open end, the tube tends to straighten. This straightening motion is transmitted through a mechanical linkage to a rotating indicator needle. The gauge requires no power source and its reading is directly proportional to the applied pressure. Its accuracy is typically specified as plus or minus 2 to 3 percent of full scale per EN 837 or ASME B40.100, and it maintains that accuracy when new and properly installed.
Bimetallic strip temperature gauges: Two metals with different coefficients of thermal expansion bonded together. When temperature changes, the differential expansion causes the strip to bend, driving a needle movement. Bimetallic gauges are used for lower-accuracy temperature monitoring in applications where the primary requirement is a go or no-go indication rather than a precise measurement.
Mechanical tachometers: Cable-driven or magnetic reluctance devices that convert shaft rotational speed into needle deflection. The mechanical connection between the rotating shaft and the needle introduces both wear over time and a response lag that makes reading transient RPM changes less precise than electronic alternatives.
The fundamental limitations of mechanical gauges follow from their physical operating principles. Mechanical linkages wear over time, introducing backlash and hysteresis that degrade accuracy. Vibration in heavy machinery applications causes needle oscillation that makes precise reading difficult. Temperature effects on the gauge mechanism itself can cause reading errors distinct from any error in the measured parameter. And critically, there is no output signal. A mechanical gauge reading cannot be logged, transmitted to a telematics platform, or used to trigger an automated alarm. It exists only as a local visual indication.
How Digital Gauges Work
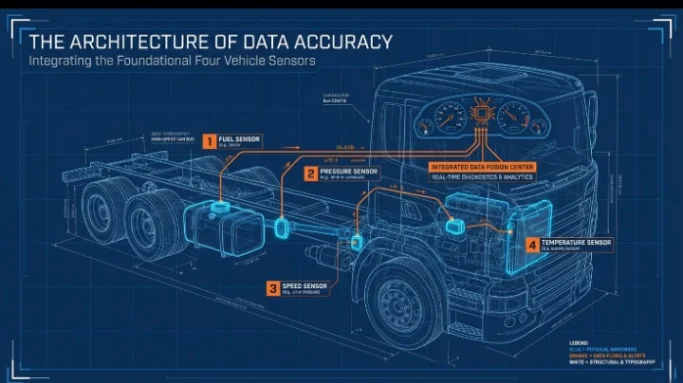
A digital gauge system consists of an electronic sensor (the measurement element), a signal conditioning circuit, a processing unit that converts the sensor signal to a calibrated engineering value, and a display element. In modern vehicle and machinery applications, the processing and display functions are typically handled by the instrument cluster or display module, while the sensor itself is mounted at the measurement point.
Pressure transducers: Most digital pressure measurement uses piezoresistive silicon strain gauge sensors bonded to a diaphragm. Applied pressure deflects the diaphragm, changing the resistance of the strain gauges in a Wheatstone bridge configuration. The bridge output is amplified and processed by signal conditioning electronics to produce a calibrated 4 to 20mA, 0.5 to 4.5V, or CAN output signal proportional to pressure. Accuracy specifications are typically plus or minus 0.5 percent or better of full scale, significantly better than a comparable mechanical gauge.
Temperature sensors: NTC (Negative Temperature Coefficient) thermistors and PT100/PT1000 resistance temperature detectors (RTDs) are the most common digital temperature sensing elements in heavy machinery applications. NTC thermistors provide high sensitivity with a non-linear resistance-temperature characteristic that ECU calibration tables compensate. RTDs provide a more linear response with higher accuracy, typically plus or minus 0.1 degrees C, suited to precision temperature monitoring in critical fluid circuits.
Digital tachometers: Magnetic reluctance or Hall effect sensors count teeth on a gear wheel or pulses from a target wheel mounted to the rotating shaft, producing a frequency output that is digitally converted to a precise RPM value. Response time is limited only by the pulse count rate, making digital tachometers far more responsive to transient RPM changes than any mechanical alternative.
Accuracy and Reliability: A Direct Comparison
The performance difference between modern digital gauges and mechanical alternatives in heavy machinery applications is quantifiable and significant.
Performance Criterion | Mechanical Gauge | Digital Gauge | Advantage |
|---|---|---|---|
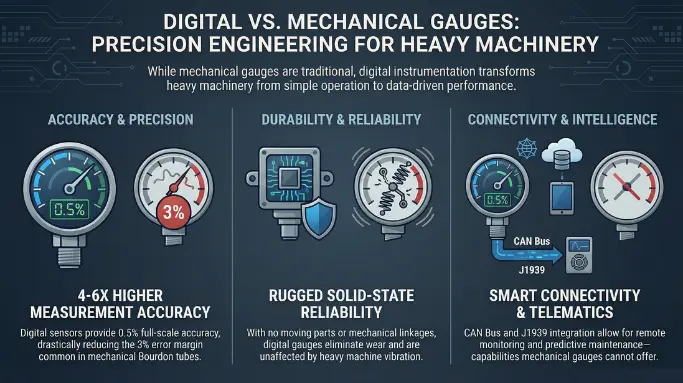
Initial Accuracy | Plus or minus 2 to 3% of full scale | Plus or minus 0.25 to 0.5% of full scale | Digital: 4 to 6x better |
Long-Term Accuracy Drift | Significant: mechanism wear and fatigue | Minimal: solid-state sensor, no moving parts | Digital: much more stable |
Vibration Resistance | Needle oscillation, spring fatigue | Digital filtering, no mechanical movement | Digital: unaffected by vibration |
Temperature Effect on Reading | Gauge mechanism errors with ambient temp | Compensated in signal conditioning | Digital: temperature compensated |
Response Time | Mechanical lag: 200 to 500ms | Signal processing: 10 to 50ms | Digital: 5 to 10x faster |
Calibration Interval | Typically 12 months or less in vibration | Every 2 to 5 years for quality sensors | Digital: longer service interval |
CAN Bus Output | Not possible (no electrical output) | Standard output for J1939 integration | Digital only |
Remote Monitoring | Not possible | Full telematics integration capable | Digital only |
Failure Mode Visibility | Gauge can drift without visible indication | Out-of-range and sensor fault detection | Digital: self-diagnostic capability |
MTBF in Vibration Environments | 5,000 to 15,000 hours (mechanism wear) | 50,000 hours or greater (solid state) | Digital: dramatically longer |
Integration Capability: Where Digital Transforms Operations
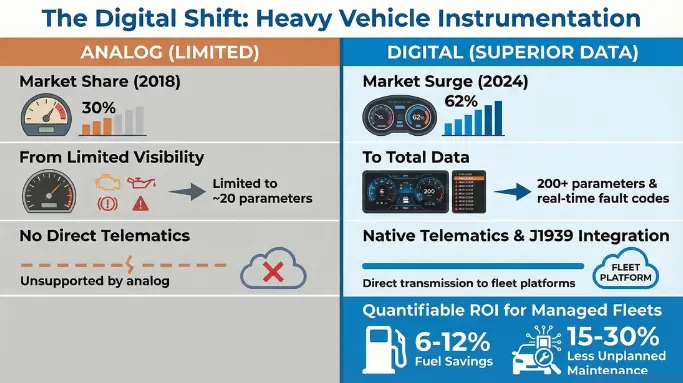
The most transformative advantage of digital gauges in heavy machinery applications is not accuracy. It is connectivity. A mechanical gauge is a local display with no downstream data capability. A digital gauge with a CAN bus output is a data source for every system in the vehicle’s information architecture.
Fleet telematics and remote monitoring: Digital pressure, temperature, and speed sensors connected to a CAN bus feed their readings into the vehicle’s telematics stream. A fleet manager monitoring 50 excavators can see the hydraulic oil temperature on every machine simultaneously, flag machines approaching thermal stress limits, and dispatch maintenance before a failure occurs. This visibility is simply not possible with mechanical gauges.
Automated alarm and interlock systems: Digital sensor outputs can trigger automated alarms when parameter thresholds are crossed, even when no operator is present. Machinery in automated or semi-automated operating modes, such as autonomous mining haul trucks or remotely supervised processing equipment, requires digital measurement for safety interlock systems that automatically shut down machines operating outside safe parameter envelopes.
Predictive maintenance from trend analysis: Historical sensor data logged over time allows detection of gradual parameter drift that indicates developing mechanical problems before they reach failure. A hydraulic pump showing a slowly declining flow rate relative to its pressure output is a pump whose internal efficiency is degrading. Trending that decline across weeks of logged data provides a maintenance prediction that mechanical gauges, with no logging capability, cannot generate.
Calibration traceability: Digital sensors with electronic calibration records support calibration traceability requirements in regulated industries, including food processing vehicles, pharmaceutical manufacturing equipment, and pressure vessels in regulated process industries. Mechanical gauge calibration requires manual test bench procedures at scheduled intervals. Electronic sensor calibration can be verified through in-situ reference measurements logged in the sensor’s calibration record.
Indication Instruments offers a range of digital display and gauge solutions designed for the integration demands of modern heavy machinery applications.
Cost and Lifecycle Considerations
The initial cost comparison between mechanical and digital gauges typically favors mechanical units for simple, standalone applications. A quality Bourdon tube pressure gauge in the 0 to 400 bar range costs significantly less than a comparable piezoresistive pressure transducer plus display module combination.
Total lifecycle cost, however, shifts this comparison meaningfully for applications with more than a few measurement points, any telematics requirement, or precision accuracy needs.
Calibration costs: A mechanical gauge in a vibrating heavy machinery environment typically requires annual calibration to maintain its accuracy specification. A quality digital pressure sensor may require calibration every 2 to 5 years. For a machinery installation with 15 to 20 gauges, the calibration cost differential over a 10-year service life is substantial.
Failure replacement costs: Mechanical gauge failures in heavy machinery are more frequent than digital sensor failures on a per-unit basis, particularly for gauges exposed to vibration and temperature cycling. The labor cost of replacing a physically inaccessible mechanical gauge in a complex machine, plus the parts cost, typically exceeds the cost differential between digital and mechanical units within the first replacement cycle.
Data infrastructure value: The telematics infrastructure that digital sensors enable reduces unplanned maintenance costs by 15 to 30 percent across well-managed fleet programs, according to McKinsey benchmarks. This benefit does not exist for mechanical gauge installations. It represents a structural cost advantage for digital instrumentation that grows with fleet size and operational complexity.
To discuss digital gauge and display solutions for your heavy machinery application, contact the Indication Instruments team for an application-specific product recommendation.
Frequently Asked Questions
Q1: Can mechanical gauges be replaced with digital equivalents without rewiring the entire machine?
In most cases, yes with some qualifications. A digital pressure transducer installs in the same threaded port as a mechanical Bourdon tube gauge. The transducer output (typically 4 to 20mA or 0.5 to 4.5V) connects to a display module via a two or three wire cable. For applications replacing multiple gauges with a single multifunction digital display, the wiring simplification is significant compared to individual sensor-to-gauge wiring runs.
Q2: What accuracy standard applies to industrial pressure gauges and how do digital transducers compare?
EN 837 and ASME B40.100 are the primary accuracy standards for mechanical Bourdon tube pressure gauges. Class 1 gauges (the most common industrial grade) are specified at plus or minus 1 percent of full scale accuracy when new. In service, accuracy degrades with time and vibration exposure. Industrial digital pressure transducers are typically specified at plus or minus 0.25 to 0.5 percent of full scale with stability specifications that are significantly better than mechanical alternatives over the same service period.
Q3: Are digital sensors more susceptible to electromagnetic interference than mechanical gauges?
Digital sensors with proper EMC design including filtered signal conditioning, shielded cables, and regulated power supply are highly resistant to electromagnetic interference in typical heavy machinery environments. Unshielded long cable runs from sensors to display modules can pick up interference from large motors and switching power supplies if not properly installed. Mechanical gauges are immune to electromagnetic interference but have no output capability, so the comparison is relevant only for applications where signal quality matters.
Q4: What is the typical accuracy drift rate for a mechanical pressure gauge in a vibrating environment?
ISO 5171 includes provisions for gauges in pulsating or vibration environments, recognizing that these conditions accelerate accuracy degradation. Field studies of mechanical gauges in construction and mining equipment environments typically show accuracy drift of 2 to 5 percent of full scale per year in continuously vibrating applications, with some units exceeding 8 percent drift in the most demanding conditions.
Q5: How do digital gauges handle power loss? Do they retain their last reading?
Behavior on power loss depends on the specific display implementation. Most instrument clusters display a defined power-off state when supply voltage is removed. They do not retain the last measurement value in the live display after power loss, which distinguishes them from a mechanical gauge that holds its last reading mechanically until pressure is released. For applications where post-power-loss state indication is operationally important, this behavior needs to be considered in the system design.
Q6: Where can I source digital gauge and display solutions for heavy machinery applications?
Indication Instruments offers a comprehensive range of digital display and instrumentation solutions for heavy machinery applications, covering pressure, temperature, speed, and multi-parameter monitoring requirements. Products are available for both new-build and retrofit programs with engineering support for integration specification.

Chief Technology Officer, Indication Instruments Ltd.
Anuj Garg has led the engineering and product development function at Indication Instruments for more than 2 decades, overseeing the design and manufacture of instrument clusters, sensors, and driver information systems for ICE and EV platforms across two-wheeler, commercial vehicle, and off-road segments. He has hands-on experience with cluster architecture for BS6 commercial vehicles, electric 3-wheelers, fleet applications, heavy vehicles, farm equipments, and leads the company’s technology roadmap.
LinkedIn: Anuj Garg