Powered by Smartsupp Blog Archives - Page 2 of 6 - Indication Instruments Ltd.
Advanced Digital Instrument Clusters for Heavy Duty Trucks and Industrial Vehicles

Advanced Digital Instrument Clusters for Heavy Duty Trucks and Industrial Vehicles

digital-instrument-clusters-heavy-duty-trucks

Introduction: The Day I Understood Heavy Duty Was a Different Problem

Several years ago I was on-site at a mining equipment manufacturer in South Africa, watching a surface excavator get fitted with a standard automotive-grade instrument cluster sourced from a commercial parts supplier. The engineering team had gone this route for cost reasons. It was a legitimate decision given the program budget. Three weeks into field trials, that cluster had failed twice, the second time during a critical payload operation. Ambient temperatures in the cab were hitting 78 degrees Celsius. The vibration envelope from the excavator arm was far outside anything the display had been tested to.

That experience shaped how I think about instrument cluster selection for heavy duty and industrial vehicle applications. The lesson was not about quality in any general sense. It was about specifications. An instrument cluster that performs flawlessly in a passenger sedan, a light commercial van, or even a standard long haul truck can fail completely in the operating environment of a mining excavator, a port container handler, or an off highway construction machine. These are categorically different problems that demand categorically different solutions.

The global market for heavy duty trucks is projected to reach USD 261 billion by 2027, according to Grand View Research. The construction equipment market is separately projected at USD 215 billion by the same year. Across both sectors, digital instrument clusters are replacing analog gauges at an accelerating rate, driven by telematics integration requirements, operator safety mandates, and the growing complexity of the vehicle systems that operators need to monitor.

This post covers what separates advanced digital instrument clusters designed for heavy duty and industrial applications from standard automotive units, the technical specifications that matter most, the protocol landscape for commercial vehicle integration, and what procurement teams and engineers should focus on when selecting solutions for demanding operational environments.

Why Heavy Duty and Industrial Vehicles Are a Different Design Problem

The fundamental difference between passenger vehicle applications and heavy duty industrial applications comes down to four factors: environment, data volume, operator consequence, and service lifecycle. Get any of these wrong, and the specification mismatch shows up quickly and expensively in the field.

Environmental Extremes

A passenger vehicle instrument cluster typically operates within a cabin that is climate controlled, insulated from road surface vibration by the vehicle’s suspension, and shielded from direct weather exposure. Heavy duty vehicles do not offer those luxuries. A mining dump truck operates with cab temperatures ranging from -40°C in northern Canadian open pit mines to above 70°C in West African iron ore operations. Agricultural equipment sits in direct sunlight for 12-hour operating shifts. Port terminal equipment is exposed to salt spray, pressure washing, and constant vibration from steel dock surfaces.

These are not edge cases. They are normal operating conditions. Any display system not rated for them will fail, and in industrial operations, display failure is not a minor inconvenience. Equipment downtime in surface mining operations costs an average of USD 12,000 per hour according to industry benchmarks published by Ernst and Young. A cluster failure that takes a piece of capital equipment offline for a shift is a material financial event.

Data Volume and System Complexity

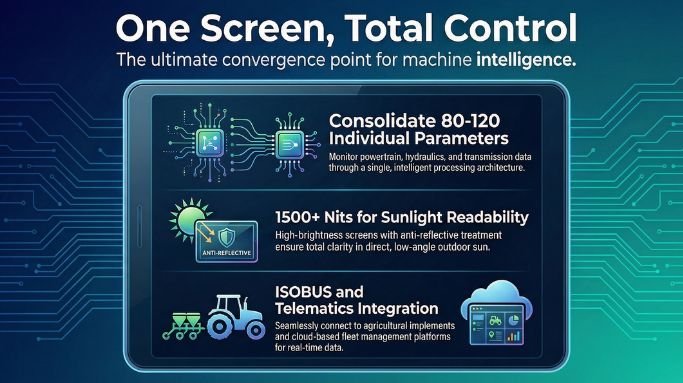
A standard passenger vehicle CAN network typically carries 30 to 60 parameters relevant to the instrument cluster display. A modern mining haul truck or offshore supply vessel can have 200 or more active sensor parameters that the operator needs access to, spanning powertrain, hydraulics, transmission oil temperature, axle load distribution, payload weight, battery status on hybrid systems, exhaust aftertreatment status, and dozens of safety interlock conditions.

The instrument cluster in these applications is not just a display. It is the operator’s primary interface with an enormously complex machine. Its ability to handle that data load reliably, prioritize alerts intelligently, and present information clearly under adverse visual conditions is directly tied to operational safety and efficiency.

Operator Safety Stakes and Regulatory Requirements

In many industrial vehicle categories, instrument cluster displays carry regulatory implications. Mining safety regulations in multiple jurisdictions mandate specific alarm display and acknowledgment behaviors. Commercial vehicle regulations in the European Union and North America impose requirements on how fault conditions and driver fatigue alerts are presented to operators. Agricultural equipment operating on public roads must comply with road safety display standards. These are not design preferences. They are compliance requirements that the cluster hardware and firmware must support.

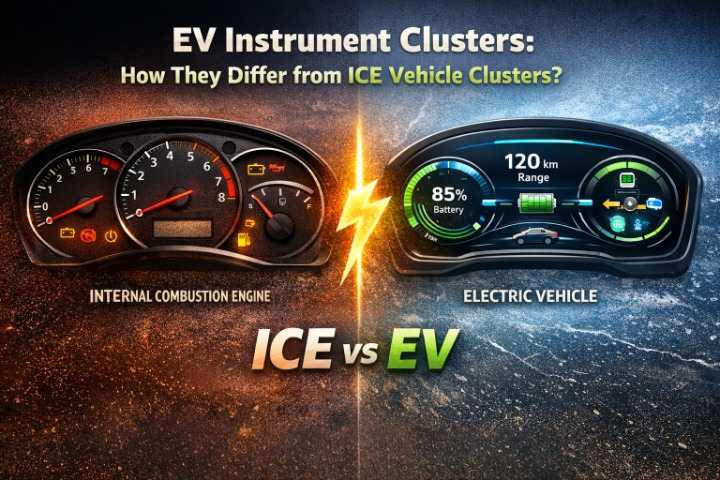
Read More : https://indicationinstruments.com/ev-instrument-clusters-how-they-differ-from-ice-vehicle-clusters/

Core Technical Specifications: What Actually Matters

I have seen procurement decisions made primarily on display resolution and screen size. Those matter, but they are far from the most important specifications for heavy duty industrial applications. Here is the hierarchy I apply when evaluating clusters for demanding deployments.

Operating Temperature and Thermal Management

Industrial-grade clusters should be rated for -40°C to +85°C minimum, with some applications requiring an even wider range. Cold start behavior is particularly important. The display must initialize and render correctly at -40°C without requiring a warm-up period that delays operator readiness. Thermal management of the display backlight and SoC is also critical because both are heat sources that can push internal temperatures above ambient in enclosed mounting configurations.

Ingress Protection and Wash-Down Resistance

IP67 provides protection against temporary immersion in water up to 1 meter depth. IP69K provides protection against high-pressure, high-temperature water jets, the standard for agricultural and construction equipment that undergoes regular pressure washing. For applications in salt water environments or chemical processing facilities, additional coatings and connector specifications matter as much as the IP rating itself.

Vibration and Shock Performance

MIL-STD-810G is the governing standard for vibration and shock performance in demanding environments. ISO 13766 covers earthmoving machinery specifically. These standards define test profiles based on the specific vibration and shock signatures of the equipment category, not generic road surface inputs. A cluster rated to MIL-STD-810G vibration profiles is a fundamentally different product from one that meets standard automotive ISO 16750-3 specifications, even if both claim vibration resistance.

Display Brightness and Sunlight Readability

In direct sunlight, a display with 800 nits of brightness becomes effectively unreadable. Industrial clusters for outdoor applications should deliver 1500 nits minimum, with premium units reaching 2000 to 2500 nits. Anti-glare treatment and anti-reflective coatings on the display cover glass are equally important because raw brightness alone does not solve the reflection problem on shiny panel surfaces. Circular polarization filters are used in some high-end agricultural and construction applications for maximum outdoor readability.

MTBF and Design Lifecycle

Consumer-grade automotive clusters are typically designed around 20,000 to 30,000 hour operational lifecycles aligned with passenger vehicle service expectations. Industrial equipment often runs for 15 to 25 years in demanding environments. MTBF ratings of 50,000 hours or greater are standard requirements in heavy mining and marine applications. Component sourcing and long-term product availability commitments from the supplier matter as much as the MTBF number itself. A cluster that cannot be sourced for replacement in year 12 of a 20-year equipment lifecycle is a significant operational risk.

The industrial display and instrumentation range at Indication Instruments is engineered around these industrial-grade requirements, covering the temperature, ingress protection, and vibration specifications that heavy duty applications demand.

Specification Comparison: Standard Automotive vs. Heavy Duty Industrial Clusters

The table below provides a direct comparison across the specifications that drive cluster selection decisions in industrial vehicle applications. These are the parameters that determine whether a product is fit for purpose, not just technically compatible.

SpecificationStandard Automotive ClusterHeavy Duty Industrial Cluster
Operating TemperatureTypically 0°C to +70°C. Suited for climate-controlled cabins.-40°C to +85°C. Designed for extreme cold starts and engine bay proximity.
Ingress ProtectionIP40 to IP52. Basic dust and drip resistance.IP67 to IP69K. Full immersion and high-pressure wash-down rated.
Vibration ResistanceISO 16750-3 automotive grade. Rated for road surface inputs.MIL-STD-810G and ISO 13766. Rated for off highway terrain and heavy machinery vibration.
Display Brightness300 to 800 nits. Designed for cabin ambient light.1500 to 2500 nits. Sunlight readable in direct outdoor exposure.
Primary ProtocolsCAN, OBD-II, LIN. Standard passenger vehicle protocols.SAE J1939, CANopen, ISOBUS (ISO 11783), ISO 11992 for truck and trailer.
MTBF (Mean Time Between Failures)20,000 to 30,000 hours. Consumer grade lifecycle.50,000 hours or greater. Mission critical uptime requirement.
EMI/EMC CertificationCISPR 25 for automotive radiated emissions.CISPR 25 plus ISO 11452 immunity testing. Heavy electrical environment compliance.
Display TechnologyTFT LCD. Standard resolution for dashboard readability.High brightness TFT or IPS panel with anti-glare and anti-reflective coating.
Parameter Monitoring Capacity30 to 60 vehicle parameters displayed and processed.200 or more simultaneous parameters across multiple CAN networks.
Customization CapabilityLimited to OEM-defined layouts. Minimal field configuration.Fully configurable display layouts, alarm thresholds, and protocol mappings.
Shock RatingStandard road shock envelope. Not rated for impact loads.25G to 50G shock rated per IEC 60068-2-27. Suited for construction and mining.

The Protocol Landscape for Heavy Duty and Industrial Applications

Protocol selection is where I see the most frequent mismatches in industrial cluster deployments. Engineers familiar with passenger vehicle integration reach for OBD-II compatibility as the default requirement. In heavy duty and industrial contexts, that is usually the wrong starting point.

SAE J1939: The Commercial Vehicle Standard

SAE J1939 is the dominant communication protocol for heavy duty on-road vehicles including Class 7 and Class 8 trucks, transit buses, and motor coaches. Built on CAN at 250 Kbit/s, J1939 provides a comprehensive parameter group numbering (PGN) system covering more than 1,000 standardized vehicle parameters. For any instrument cluster deployed in a commercial on-road vehicle, J1939 fluency is not optional. It is the language the vehicle speaks.

One thing I always clarify with engineering teams new to J1939: reading standard PGNs is straightforward, but most commercial vehicle OEMs also use proprietary PGNs for vehicle-specific parameters. A cluster that handles standard J1939 but cannot be configured to parse proprietary PGN extensions will miss significant operational data in many commercial fleet deployments.

ISOBUS (ISO 11783): Agricultural and Construction Equipment

ISOBUS is the protocol standard for agricultural tractors and implements, defined by ISO 11783 and built on J1939 architecture. It enables implement-specific parameters from attached machinery, such as seed rate, fertilizer flow, and harvesting metrics, to be displayed on the tractor instrument cluster. For construction equipment operating alongside precision agriculture systems or sharing site management infrastructure, ISOBUS compatibility is increasingly relevant.

CANopen: Specialized Industrial Applications

CANopen is widely used in industrial machinery, cranes, material handling equipment, and marine applications where J1939 is not the governing standard. It provides a flexible object dictionary architecture that maps well to the varied sensor and actuator configurations of specialized industrial machines. Instrument clusters deployed in overhead cranes, port equipment, or process industry vehicles frequently need CANopen support alongside or instead of J1939.

ISO 11992: Truck and Trailer Communication

ISO 11992 governs the electrical connections and communication between trucks and their towed trailers, covering brake systems, lighting, and monitoring data. For long haul freight operators deploying connected instrument clusters with full trailer visibility, ISO 11992 integration is the mechanism by which trailer system status appears on the cab display.

When evaluating instrument cluster solutions for commercial vehicle programs, requesting a clear protocol support matrix with specific PGN coverage documentation for J1939 deployments saves considerable integration time. Generic protocol compatibility claims should be validated against the actual parameter requirements of the vehicle before procurement commitment.

Application Segments: What Each Industry Requires

Heavy duty and industrial vehicle applications are not a single market. Each segment has its own operational context, regulatory environment, and display requirements. Understanding these differences before selecting a cluster platform matters considerably.

Mining: The Most Demanding Environment

Surface mining operations run some of the most demanding vehicle environments on earth. Haul trucks in large open pit mines carry payloads of 300 to 400 tonnes over broken rock surfaces, generating continuous high-frequency vibration and episodic shock loads well outside standard automotive test envelopes. Cab temperatures in equatorial mining operations routinely exceed what standard cluster hardware is rated for. Safety-critical displays in these applications, particularly those showing payload weight, tyre pressure, and brake system status, must maintain operation and accuracy under all conditions without degradation.

Many mining jurisdictions also impose specific requirements on operator alarm acknowledgment behavior and the audit trail of safety-related display events. Clusters in these applications need to support event logging and alarm management capabilities beyond standard display functionality. According to industry data from the International Council on Mining and Metals, equipment availability improvements of even two percent in large surface mining operations translate to annual revenue impacts in the tens of millions of dollars.

Construction and Earthmoving Equipment

Construction equipment operates in outdoor environments across a wider range of machine types than mining: excavators, wheel loaders, motor graders, compactors, and articulated haulers, each with specific display requirements. Sunlight readability is consistently the most critical display specification in this segment given the extended outdoor operating hours. Telematics integration requirements are also growing rapidly, driven by construction site management platforms that need real time machine utilization, fuel consumption, and maintenance status data visible both on the machine and at the site management office.

Long Haul Trucking and Freight Logistics

Long haul freight vehicles have driven the most standardized digital cluster deployments in the heavy duty category, largely because of the mature J1939 ecosystem and the well-developed commercial fleet telematics market. Driver hours of service compliance, fuel efficiency monitoring, predictive maintenance alerts, and navigation integration are all standard cluster capabilities in modern Class 8 deployments. The instrument cluster is the primary interface through which telematics intelligence reaches the driver, making display clarity and alert priority management directly relevant to compliance and safety outcomes.

Port and Marine Applications

Container handlers, reach stackers, and ship-to-shore cranes in port environments face a specific combination of salt air corrosion risk, pressure wash exposure, and continuous duty cycle operation. Instrument clusters in these applications need IP69K ratings, marine-grade connector sealing, and anti-corrosion coatings on all exposed metal components. The ruggedized display solutions at Indication Instruments address the IP rating and environmental sealing requirements that port applications specifically impose.

Procurement and Selection: The Questions That Matter

After years of working on instrumentation procurement for heavy duty programs, the selection process I follow has become fairly disciplined. The criteria that separate adequate from excellent in this category are often not the ones that appear first in a product specification sheet.

Protocol Compatibility and Configuration Depth

Identify every protocol the vehicle network uses. Ask the supplier for PGN-level documentation for J1939 coverage, and verify that proprietary extensions your vehicle OEM uses are configurable. Superficial protocol compatibility is a common source of late-stage integration problems that are expensive to resolve.

Environmental Certification Evidence

Ask for test reports, not just specification claims. Third-party test reports to MIL-STD-810G, IEC 60068-2 shock and vibration, and the relevant IP standard should be available from any credible industrial cluster supplier. Certificate numbers and test laboratory names can be verified independently. This step eliminates a significant portion of options that overstate environmental capability on datasheets.

Display Performance in Your Actual Lighting Conditions

Nit ratings measured in controlled laboratory conditions do not always translate directly to readability in the operating environment. If your application involves direct sunlight or highly variable ambient lighting, request a physical sample and test it in your actual operating conditions before committing to volume procurement. Anti-glare coating quality and cover glass reflection characteristics vary meaningfully across suppliers at similar brightness specifications.

Supplier Longevity and Component Lifecycle Commitments

For equipment with 15 to 20 year service lifespans, the ability to procure replacement clusters a decade from now is a real operational risk. Ask suppliers directly about their component sourcing policy and long-term product availability commitments. Suppliers who design around industrial-grade components with multi-decade availability commitments from semiconductor manufacturers are a meaningfully lower lifecycle risk than those using consumer-grade components with short production windows.

Reaching out to the Indication Instruments team for an application-specific consultation is a practical first step when defining specifications for a heavy duty or industrial cluster procurement program.

Where Heavy Duty Cluster Technology Is Headed

The trajectory of advanced display technology in heavy duty and industrial vehicles is being shaped by several converging pressures, and I think it is worth naming them directly because they have real implications for procurement timing and platform selection.

High Brightness IPS and OLED Migration

Industrial IPS panels delivering consistent color and contrast at wide viewing angles are replacing standard TFT displays in premium heavy duty applications. OLED technology, which eliminates the backlight entirely and enables perfect black levels with lower power consumption, is beginning to appear in prototype industrial applications. The main obstacle for OLED in heavy duty use is image retention risk under static display conditions, a known limitation of OLED technology when the same elements remain on screen for extended periods. Panel manufacturers are addressing this through pixel shift algorithms, but it remains a design consideration for the near term.

ADAS Integration in Commercial Vehicles

Advanced driver assistance systems are moving down from premium passenger vehicles into commercial fleet applications at an accelerating rate, driven partly by insurance economics and partly by regulatory mandates. Forward collision warning, lane departure detection, and driver fatigue monitoring systems all surface alerts through the instrument cluster. Commercial vehicle clusters need the processing headroom and display real estate to handle ADAS overlay data alongside the standard vehicle parameter display without compromising readability of either.

Unified Fleet Intelligence Dashboards

The next generation of commercial fleet cluster deployments is moving toward unified operator intelligence platforms where the instrument cluster integrates real time fuel efficiency coaching, route optimization data from cloud platforms, maintenance prediction alerts triggered by machine learning models processing sensor history, and regulatory compliance monitoring all within a single coherent display interface. The clusters that will anchor these deployments are the ones specified today with the right protocol support, processing capacity, and connectivity architecture.

Frequently Asked Questions

Q1: What is the most important specification difference between automotive and heavy duty industrial instrument clusters?

Operating temperature range and vibration resistance are typically the most critical differentiators. Standard automotive clusters are designed for climate-controlled cabin environments and normal road surface vibration profiles. Heavy duty industrial clusters must operate reliably at -40°C through +85°C and withstand vibration and shock profiles defined by MIL-STD-810G or ISO 13766 that are far outside automotive test envelopes. These environmental specifications drive fundamental differences in component selection, thermal management design, and enclosure engineering.

Q2: Why is SAE J1939 preferred over OBD-II for heavy duty commercial vehicle applications?

SAE J1939 provides a parameter group numbering system covering more than 1,000 standardized vehicle-specific parameters tailored to commercial vehicle systems including heavy powertrain, transmission, exhaust aftertreatment, and axle systems that are not covered by OBD-II. J1939 also operates at 250 Kbit/s with a network topology better suited to the larger vehicle architectures of heavy commercial vehicles. OBD-II was designed for passenger and light vehicle emission diagnostics. For Class 7 and Class 8 trucks, J1939 is the correct protocol foundation.

Q3: What IP rating should I require for heavy duty outdoor equipment instrument clusters?

IP67 provides protection against temporary water immersion and is suitable for most construction and agricultural applications exposed to rain and splash. IP69K provides protection against high-pressure, high-temperature water jets and is the standard for equipment that undergoes regular pressure washing, including agricultural machinery, food processing vehicles, and port equipment. For marine applications with salt spray exposure, IP ratings should be evaluated alongside connector sealing specifications and corrosion protection coatings.

Q4: How many CAN networks can a heavy duty instrument cluster typically interface with simultaneously?

Advanced industrial clusters support two to four independent CAN networks simultaneously. This is important because heavy commercial vehicles commonly segment their networks: a powertrain CAN network for engine and transmission data, a body and chassis network, a telematics network, and in some configurations a dedicated safety system network. A cluster that can only read a single CAN network will miss significant operational data in multi-network vehicle architectures.

Q5: What does MTBF of 50,000 hours actually mean in practical fleet terms?

At 50,000 hours MTBF and assuming 2,500 operating hours per year for a commercial vehicle, the statistical mean failure interval is 20 years. In a fleet of 100 vehicles at that utilization rate, you would statistically expect one cluster failure every approximately 73 days across the fleet. This is a significant reliability advantage over consumer-grade clusters with 20,000-hour MTBF ratings, where the same fleet would see roughly two and a half times more failures over the same period, each representing unplanned maintenance costs and potential operational disruption.

Q6: Where can I find heavy duty and industrial grade instrument cluster and display products?

Indication Instruments supplies digital display and instrumentation solutions engineered for heavy duty and industrial vehicle applications, covering the environmental, protocol, and reliability specifications that demanding deployments require. Explore the full product range or contact the team for an application-specific product recommendation.

How Digital Instrument Clusters Are Shaping the Future of Commercial Vehicle Dashboards?

How Digital Instrument Clusters Are Shaping the Future of Commercial Vehicle Dashboards?

How Digital Instrument Clusters Are Shaping the Future of Commercial Vehicle Dashboards?

A time once existed when the truck driver’s dashboard was a mere group of mechanical gauges – a speedometer, a fuel gauge, an oil pressure gauge, and perhaps a temperature gauge whose pointer moved dangerously close to the red zone whenever the engine wasn’t pleased. That served the purpose well. It gave you minimal information regarding what was going on inside the machine and offered no warning regarding what could possibly happen in the future.

Times have changed and rapidly at that. The arrival of digital instrument panels is here to stay, and its impact is much more than superficial. This innovation will redefine the way drivers perceive their machines, fleet managers keep tabs on their assets, and manufacturers view issues related to safety and compliance. If you are part of the commercial trucking, logistics, or construction industry, you owe it to yourself to learn more about this technological leap forward.

34%
reduction in unplanned downtime reported by fleets using digital clusters
2.8x
faster fault identification vs. traditional analog gauges
$180B+
global commercial vehicle telematics market by 2030

What Exactly Is a Digital Instrument Cluster?

A digital instrument cluster replaces the traditional mechanical gauges on a vehicle’s dashboard with a fully configurable screen or set of screens. Instead of physical needles moving over printed scales, the driver sees real-time data rendered visually on a high-resolution display. Speed, RPM, fuel level, coolant temperature, oil pressure, battery voltage, turbo boost, gear position and dozens of other parameters can all be shown simultaneously or cycled through based on context.

But calling it just a “screen” undersells what it actually is. A modern digital cluster is a data hub. It pulls information from the vehicle’s CAN bus, communicates with engine control units, sensor networks, and increasingly with cloud-based fleet management systems. It is the front-end interface for an entire ecosystem of instrumentation working quietly in the background.

At Indication Instruments, we have spent years building and supplying precision instrumentation for exactly this kind of ecosystem, from electronic pressure sensors to temperature sensors and level sensors. What we see in the field tells us that the quality of the underlying sensors is just as important as the display itself. A beautiful dashboard showing inaccurate data is worse than useless.

“A digital instrument cluster is only as reliable as the sensors feeding it. Precision at the measurement point determines the quality of every decision made at the display.”

Why Commercial Vehicles Specifically Need This Upgrade

Passenger cars have had digital dashboards for years, so why does the commercial vehicle space feel like it is catching up? The answer lies in the operating environment. A long-haul truck, a mining dump truck, or a construction excavator operates under conditions that are genuinely extreme. High vibration, wide temperature swings, prolonged engine loads, and constant exposure to dust, moisture, and contaminants mean that instrumentation has to be rugged first and intelligent second.

Until recently, the electronics required for sophisticated digital clusters were not reliable enough to justify the risk in these environments. That has changed. Advances in ruggedised display technology, improvements in IP-rated sensor design, and the maturation of industrial-grade CAN bus communication protocols have made digital clusters genuinely viable for heavy-duty commercial use.

There is also a regulatory pressure angle. Across markets, emissions regulations, driver hours-of-service requirements, and vehicle safety standards are all demanding more detailed and auditable vehicle data. A digital cluster that integrates with a fleet management platform makes compliance considerably easier to manage.

Related Read: https://indicationinstruments.com/analog-vs-digital-instrument-cluster-key-differences/

The Real Benefits on the Ground

Smarter Fault Detection Before Things Break

One of the most practical improvements digital clusters bring is predictive fault visibility. Analog gauges tell you where something is right now. Digital systems can show you the trend over time. An oil pressure reading that is sitting at the low end of normal but slowly declining is a completely different situation from one that has been stable for 500 km. With a digital cluster connected to high-accuracy pressure sensors, that trend is visible and can even trigger warnings before a threshold is crossed.

Fleet managers we speak to regularly cite unexpected breakdowns as one of their biggest cost drivers. The ability to catch a developing problem during a planned stop rather than on the side of a highway is worth far more than the cost of the technology itself.

Driver Behaviour and Fuel Efficiency

Digital clusters can show drivers real-time fuel consumption, engine load, and driving efficiency scores in a way that analog systems simply cannot. When a driver can see that their current acceleration style is pushing fuel consumption up by 12%, there is a natural incentive to adjust. Studies across commercial fleets have consistently shown fuel savings of 5 to 10% after the introduction of real-time efficiency feedback through digital dashboards.

Simplified Compliance and Data Logging

Tachograph data, maintenance intervals, engine hours, fault codes and emission readings can all be logged automatically when a digital cluster is connected to the right backend. For fleet operators managing dozens or hundreds of vehicles, this alone justifies the investment. Instead of relying on drivers to manually log information, the vehicle records what it needs to record as a matter of course.

Customisation for Specific Applications

A concrete mixer has different priority information than a refrigerated trailer. A mining haul truck needs different alerts than an urban delivery van. Digital clusters can be configured to show only the parameters most relevant to a specific application, reducing cognitive load for the driver and making critical information easier to spot at a glance. Customisable sensor and display solutions are increasingly the norm rather than the exception in the commercial vehicle sector.

Digital vs. Analog: A Clear Comparison

To understand what is actually at stake in this transition, it helps to look at the two approaches side by side across the dimensions that matter most to commercial vehicle operators.

FeatureAnalog Instrument ClusterDigital Instrument Cluster
Real-time data displayBasic (single values only)Multiple parameters simultaneously
Trend monitoring over timeNot availableHistorical trend graphs available
Fault code displayWarning lights onlyDetailed fault description on screen
Configurable layoutFixedFully customisable per application
Fleet telematics integrationNot possibleNative integration available
Predictive maintenance alertsNot availableThreshold and trend-based alerts
Driver efficiency feedbackNot availableReal-time fuel and load data
Durability in harsh envs.Proven over decadesImproving with ruggedised designs
Initial costLower upfrontHigher upfront, lower total cost of ownership
Compliance data loggingManual onlyAutomatic and auditable
Night visibilityBacklighting onlyAdaptive brightness with anti-glare
Software updatabilityNot possibleOTA updates possible

The Sensor Layer: Where the Data Actually Comes From

Any conversation about digital instrument clusters eventually has to come back to sensors. The cluster itself is the display layer. The intelligence behind it depends entirely on the accuracy, reliability, and response speed of the sensors feeding it data in real time.

In a commercial vehicle, the sensors that matter most include pressure sensors monitoring engine oil, transmission fluid, fuel delivery, and brake systems; temperature sensors covering coolant, exhaust, cabin, and cargo; level sensors for fuel, hydraulic fluid, and coolant; and speed sensors feeding into tachometer and odometer readings.

When any of these sensors drifts out of calibration, delivers intermittent signals, or fails outright, the beautiful digital display becomes a source of misinformation rather than insight. This is why the quality of the sensor hardware is not a secondary consideration. It is foundational.

Our IP66-rated electronic pressure sensors are specifically designed to hold accurate, stable output across the kinds of vibration, temperature variation, and contamination exposure that commercial vehicles experience in real operating conditions. If you are specifying instrumentation for a digital cluster integration, that level of robustness is not optional.

Also Read: https://indicationinstruments.com/electronic-vs-electromechanical-pressure-sensors/

What the Industry Looks Like Right Now

The adoption curve for digital instrument clusters in commercial vehicles is steepening. Major OEMs across Europe, North America, and Asia have been rolling out digital-first dashboards in their heavy-duty lineups over the past few years. Tier 1 and Tier 2 suppliers are competing heavily in the space, and retrofit solutions are emerging for fleet operators who want to upgrade existing vehicles without full replacement cycles.

The integration with telematics platforms is particularly interesting. Systems like Webfleet, Samsara, and Geotab are now designed to work directly with digital cluster data streams, turning raw sensor readings into actionable fleet intelligence. A fleet manager sitting in an office can see the oil pressure trend of a truck 800 km away, assess whether it needs to divert for a service stop, and communicate that decision to the driver, all in real time.

This is not science fiction. It is operational reality for the fleets that have made the investment.

Challenges That Are Still Worth Acknowledging

The picture is not entirely without complication. Digital clusters introduce software dependencies that analog systems simply do not have. A software bug or a failed display module can render a truck inoperable in a way that a stuck gauge needle never would. Cybersecurity is also a genuine concern as commercial vehicles become more connected. A CAN bus that communicates with cloud services is a potential attack surface that did not exist in the purely mechanical era.

There is also the question of total cost. While the long-term economics of digital clusters are compelling, the upfront investment is meaningfully higher, particularly for smaller fleet operators who may struggle to justify the capital expenditure against uncertain ROI timelines.

These are real considerations, not reasons to avoid the technology. But they are reasons to be thoughtful about implementation and to work with suppliers who understand the full operating context of commercial vehicles, not just the technology itself.

Thinking About Upgrading Your Fleet’s Instrumentation?
Our team can help you identify the right sensor configuration for your digital cluster integration.
From IP66 pressure sensors to custom temperature and level measurement solutions.

Frequently Asked Questions

What is the difference between a digital instrument cluster and a digital dashboard?

These terms are often used interchangeably, but there is a subtle distinction. A digital instrument cluster specifically refers to the display that replaces traditional gauges and shows vehicle operating data such as speed, engine RPM, temperature, and pressure. A digital dashboard is a broader term that can include infotainment systems, navigation, and driver assistance displays alongside the cluster. In commercial vehicles, the instrument cluster is the safety-critical component because it carries real-time vehicle health data.

Can digital instrument clusters be retrofitted to older commercial vehicles?

Yes, in many cases they can. Retrofit solutions are available that connect to the vehicle’s existing CAN bus and sensor network. The key requirement is that the underlying sensors must be capable of delivering digital or analogue output that the new cluster can interpret. In some cases, older vehicles will need sensor upgrades alongside the cluster replacement. Our team at Indication Instruments can advise on what sensor upgrades are typically needed for a successful retrofit.

How durable are digital instrument clusters in harsh commercial environments?

Modern commercial-grade digital clusters are designed to handle significant vibration, temperature extremes, and moisture exposure. Look for clusters with high ingress protection ratings and operating temperature ranges appropriate for your specific application. Mining, construction, and agricultural applications are the most demanding and require the highest-spec hardware. The sensors feeding the cluster need the same level of ruggedness.

What sensors are most important for a commercial vehicle digital instrument cluster?

The core sensors are engine oil pressure, coolant temperature, fuel level, transmission temperature, and vehicle speed. Beyond these fundamentals, many fleets add exhaust temperature sensors for diesel particulate filter monitoring, tyre pressure sensors for TPMS integration, and brake system pressure sensors for safety monitoring. The more sensors feeding accurate data into the cluster, the more complete the picture the driver and fleet manager receive.

Is a digital instrument cluster worth the investment for a small fleet?

The ROI calculation depends heavily on the type of vehicles you operate and how much unplanned downtime currently costs you. For high-utilisation vehicles like long-haul trucks, mining equipment, or construction machinery, even a single avoided breakdown can justify the cost of cluster upgrades across multiple vehicles. For lighter-duty or lower-utilisation fleets, the payback period is longer. We would recommend starting with a pilot on your highest-cost vehicles and measuring the impact on maintenance costs and fuel efficiency before rolling out more broadly.

How does a digital cluster connect to fleet management software?

Most modern digital clusters communicate via CAN bus or LIN bus protocols, which can then feed into a telematics gateway unit connected to the internet. The gateway transmits data to cloud-based fleet management platforms in near real time. Some clusters also have direct Wi-Fi or cellular connectivity built in. The specific integration method depends on the cluster hardware and the fleet management software you are using.

EV Instrument Clusters: How They Differ from ICE Vehicle Clusters?

EV Instrument Clusters: How They Differ from ICE Vehicle Clusters?

EV Instrument Clusters: How They Differ from ICE Vehicle Clusters?

A few months ago, an OEM customer called me to ask a question I have been hearing more and more often: “We are moving one of our platforms to electric. Can we just use the same cluster we’ve been using for the past eight years?”

The short answer is no. The longer answer is what I want to walk you through in this post.

I have spent over two decades working on vehicle instrumentation — clusters, sensors, driver information systems. The transition from ICE to EV is, without question, the most significant shift I have seen in how we think about what a cluster needs to do. It is not just a new product requirement. It is a fundamentally different design brief.

So whether you are an OEM engineer, a procurement lead, or a fellow supplier trying to figure out where your product needs to go — let me break it down the way I would over a whiteboard session.

“The shift from ICE to EV is not just a new product requirement. It is a fundamentally different design brief.”

First — What Exactly Is an Instrument Cluster?

I always start here because it grounds the conversation. An instrument cluster sometimes called a driver information panel or gauge cluster is the primary interface between the vehicle and its driver. Its job is to surface critical data in real time: how fast you are going, whether the engine or motor is running well, how much energy you have left, and whether anything is wrong.

Traditionally, clusters combined physical analog needles with a small LCD segment display. If you want to understand that earlier transition in detail, our post on Analog vs Digital Instrument Clusters covers it well. But the leap from a digital ICE cluster to a proper EV cluster is an even bigger jump, because in an EV, the engine is gone, the fuel tank is gone, and with them, many of the fundamental gauges that defined dashboards for a hundred years.

What an ICE Cluster Is Actually Monitoring?

Let me give you a clear picture of the ICE cluster’s world. Its entire job is monitoring a combustion engine and its consumables. The core gauges almost never change, regardless of whether the vehicle is a scooter or a heavy truck:

  • Tachometer (RPM) — how hard the engine is working
  • Speedometer — vehicle speed
  • Fuel level gauge — how much is left in the tank
  • Coolant temperature — is the engine overheating?
  • Oil pressure warning — is lubrication failing?
  • Battery / charging indicator — for the 12V ancillary system

Most of that data comes in via analogue signals or, in modern vehicles, over J1939 or CAN 2.0 protocols. The cluster reads those signals and moves the pointer motors or lights up the segments. It is a mature, well-understood system. The supply chain is deep. Validation is well-documented.

That is precisely what makes the question “can we just reuse the same cluster for EV?” so understandable and so problematic.

What an EV Cluster Needs to Do? — and Why It Is So Different?

When a vehicle runs on electricity, the entire monitoring logic changes. There is no combustion cycle to watch. Instead, your cluster needs to simultaneously manage information from a battery pack, an electric motor, a thermal management system, a regenerative braking system, and a charging management module.

Here is what the core EV gauge set looks like:

  • State of Charge (SoC) — the EV fuel gauge. Expressed as a percentage of remaining battery capacity
  • Estimated Range — calculated dynamically using SoC, driving style, ambient temperature, and terrain
  • Power Flow Indicator — shows whether energy is going battery-to-motor (discharging) or motor-to-battery (regenerating)
  • Regenerative Braking Meter — indicates how much energy is being recovered during deceleration
  • Motor Temperature — replaces coolant temp; the motor and inverter generate heat that must be tracked
  • Battery Thermal Status — shows the temperature of the battery pack itself — multi-zone in commercial EVs
  • Charging Status & Rate — when plugged in: charge level, charging rate in kW, estimated time to full

And then there are the warning lamps. Where an ICE cluster might carry 15 to 20 Malfunction Indicator Lamps — your classic Check Engine, Oil Pressure, Battery Warning — an EV cluster can have 30 to 50 or more distinct fault categories.

Battery Management System faults, inverter overtemperature, charging port errors, regen braking limits — all of these need to reach the driver clearly and safely. Our post on how Driver Information Systems improve vehicle safety goes into the design philosophy behind managing this level of data without overwhelming the driver.

The Full Picture: ICE vs EV Clusters comparison

I find this kind of direct comparison table genuinely useful when I am in a specification meeting with OEM customers. Here is what changes, parameter by parameter:

ParameterICE Instrument ClusterEV Instrument Cluster
Core GaugesRPM tachometer, Fuel level, Oil pressure, Coolant temperatureState of Charge (SoC), Range estimator, Power flow, Regen braking indicator
Power Architecture12V lead-acid battery charged by alternatorHigh-voltage pack (100V–800V+) with DC-DC converter stepping down to 12V
Communication ProtocolCAN 2.0 (up to 1 Mbps) or J1939 for CVsCAN 2.0 or CAN FD (up to 8 Mbps)
Display TechnologyAnalog needles + small LCD segment displayAnalog needled + colour TFT mostly or fully digital
Thermal MonitoringSingle coolant temperature gaugeMulti-zone: battery pack, motor winding, inverter, DC-DC converter
Energy DataFuel level (%) + estimated km rangeSoC (%), real-time kWh/km consumption, regenerated energy recovered
Software DependencyMostly Embedded C basedEmbedded-C, Embedded OS (Linux/android/QNX), RTOS
Warning Indicators~40-50 MIL lamps (Check Engine, Oil, Battery, etc.)50+ including BMS fault, charge error, motor overheat, regen limit
CustomisationLimited changes/ modification through Softwaremultiple drive-mode themes via OTA updates in fully digital clusters
Form Factor TrendSeparate cluster + separate infotainment head unitIntegrated digital cockpit — single wide screen spans cluster and IVI
Indian Market MaturityMature; deep supply chain; well-understood validationEmerging; fast-growing under FAME II, PLI Scheme, BS6 Phase 2 push

Table: Indication Instruments Ltd. internal product specification matrix, April 2026

The Communication Protocol Shift Nobody Talks About Enough

One of the things I find myself explaining most often is the data bandwidth problem.

ICE vehicles largely run on CAN 2.0 and J1939/a>. These are battle-tested protocols, designed in the late 1980s and 1990s, that top out at 1 Mbps. That is plenty for an ICE drivetrain with a handful of ECUs.

An EV powertrain generates vastly more data — individual cell voltages across a 96-cell pack, thermal zone readings, motor torque maps, regen events, BMS state transitions. You cannot push all of that through a CAN 2.0 bus reliably. So modern EVs are moving to:

  • CAN FD (Flexible Data-Rate) — up to 8 Mbps; backward-compatible at the hardware level with CAN 2.0
  • Automotive Ethernet (100BASE-T1) — up to 100 Mbps; used for display rendering, OTA firmware updates, and camera feeds
  • LIN Bus — still used for lower-priority accessories like ambient lighting and HVAC control

This is not just a spec-sheet change. It requires a different hardware architecture inside the cluster, different firmware, and a significantly more demanding validation process. When we are spec-ing an EV cluster, protocol compatibility is one of the first things we nail down with the customer.

Engineering Note: If you are in early platform architecture discussions, insist on CAN FD support as a baseline for any EV cluster. The incremental cost over CAN 2.0 hardware is small at the component level; the cost of retrofitting the architecture mid-program is not.

Software-Defined Clusters: The Shift That Changes Everything

This is the part that I think surprises people the most when they move from ICE to EV cluster procurement for the first time.

An ICE cluster is, at its core, hardware-defined. The layout, the gauge ranges, the warning logic, all of that is fixed at the tooling stage. If the OEM wants to add a new MIL or change the speedometer range, they need a new cluster. That is just the reality.

An EV cluster runs an embedded operating system. It renders the display through a GPU. It can receive firmware updates over the air after the vehicle leaves the factory. That means:

  • Drive mode themes: Eco, Normal, Sport, can show completely different colour schemes and data layouts
  • New warning indicators can be deployed via OTA without touching the hardware
  • The same physical cluster unit can be reprogrammed for different vehicle derivatives on the same platform
  • ADAS alerts: lane departure warnings, forward collision alerts, can be rendered directly within the cluster view

For OEMs, this is genuinely transformative. You get a longer product life out of the same hardware investment, and you can iterate the user experience post-launch. But it also means your cluster supplier needs embedded software capability, not just hardware manufacturing quality. That is a non-trivial shift in how you evaluate a supplier.

“In EV cluster procurement, your supplier’s embedded software capability is now as important as their hardware manufacturing quality.”

What This Means for Commercial Vehicles and Fleets in India?

India’s EV transition is happening fastest where it matters most commercially: two-wheelers and commercial vehicles. And both of those segments are close to my heart, because they are the segments where cluster design decisions have direct, real-world safety consequences.

Electric buses, three-wheelers, and light commercial EVs have cluster requirements that extend well beyond what a personal EV needs. Our post on instrument clusters for buses and panels covers some of the context here. For EV commercial vehicles specifically, you also need:

  • Integration with AIS 140-compliant fleet telematics — which is mandatory for commercial vehicles in India
  • Dynamic range estimation that accounts for payload weight, road gradient, air conditioning load, and driver behaviour
  • Multi-zone battery monitoring for large-format pack configurations
  • Displays rated for vibration, dust, and wide ambient temperature swings — essential for last-mile delivery in Indian conditions

Fleet operators who have been running ICE vehicles for twenty years will find the procurement criteria for EV clusters quite different. I would encourage you to start those conversations early ideally at platform concept stage, not after the vehicle architecture is locked.

Where Indication Instruments Is Heading on EV

I will be transparent about where we are and where we are going. At Indication Instruments, we have been manufacturing instrument clusters and sensors and switches for ICE platforms for decades. We understand the manufacturing quality, the validation rigour, and the OEM relationship model that this industry demands.

Our engineering investments are now firmly pointed at EV-ready architectures. Specifically:

  • CAN FD-compatible cluster platforms for 2-wheeler, 3-wheeler, and light commercial EV applications
  • SoC display modules with BMS integration support — compatible with the major battery management systems used in the Indian market
  • Multi-zone thermal sensor input handling for battery pack monitoring
  • Configurable warning lamp logic covering EV-specific fault categories, including BMS, motor controller, and inverter faults

If you are planning an EV platform and want to talk through cluster requirements before the RFQ stage, I would genuinely welcome that conversation. You can reach us through our contact page, and I am also happy to have a direct technical discussion. That is the kind of engagement that I think leads to better products for everyone.

Final Thought

The instrument cluster has always been the most human part of the vehicle, the one piece of technology that speaks directly to the driver every single time they sit behind the wheel. In an EV, that job gets harder and more important simultaneously.

Getting it right means understanding not just the new gauges and the new protocols, but the new philosophy: a display that must handle more data, more complexity, and more software sophistication, while still being clear, readable, and trusted at a glance.

That is the challenge we are working on at Indication Instruments. I hope this post helps you think through it for your platform too.

Frequently Asked Questions

Q1. Can an existing ICE instrument cluster be retrofitted into an EV platform?

Technically possible — practically inadvisable. An ICE cluster is calibrated to interpret analogue signals and specific CAN messages from an ICE ECU. An EV powertrain sends entirely different messages: SoC data from the BMS, torque data from the motor controller, and regeneration status — none of which the ICE cluster was built to read.

You can get around this with a CAN gateway module that translates EV data into ICE-equivalent signals — but what you end up with is a cluster that cannot show range, cannot show thermal status, and cannot surface EV-specific faults. For a prototype or a proof of concept, maybe. For a production vehicle, you owe your customers better than that.

Q2. What is State of Charge (SoC) and how does the cluster actually display it?

SoC is the remaining energy in the battery pack expressed as a percentage of its total capacity — the direct equivalent of a fuel gauge. The Battery Management System (BMS) calculates it using Coulomb counting (tracking current flowing in and out of the pack), Open Circuit Voltage measurement, and temperature-corrected capacity modelling.

The BMS sends the SoC value as a CAN message to the instrument cluster, which then renders it as a percentage bar, a segmented arc, or a dial depending on the OEM’s UX design. One nuance worth flagging: SoC accuracy degrades as the battery ages, which is why thoughtful EV clusters also expose State of Health (SoH) as a separate parameter for fleet management use cases.

Q3. How does an EV cluster differ between a 2-wheeler and a commercial vehicle?

Significantly. A 2-wheeler EV cluster is compact, designed around a single LFP or NMC cell pack with a relatively simple BMS. The display priorities are SoC, speed, and a handful of warning lamps. Form factor, glare resistance in Indian sunlight, and vibration tolerance are the critical design parameters.

A commercial EV cluster, for an electric bus or a three-tonne truck is a different beast. Multi-pack battery architectures, AIS 140 fleet telematics integration, regen efficiency data, complex fault diagnostics across dozens of ECUs, and a display that must remain readable in a cab environment. The data bandwidth, display size, and software complexity are all in a different league.

Related: Instrument Clusters for Buses and Panels — Why They Matter

Q4. What communication protocols should I mandate when sourcing an EV cluster?

My baseline recommendation: specify CAN FD (ISO 11898-2) support as a non-negotiable. For 2-wheeler and passenger EVs, also ask about 100BASE-T1 Ethernet support for display rendering and OTA connectivity. LIN Bus is still useful for ancillary inputs.

For commercial vehicles on Indian roads: buses, trucks, last-mile delivery vehicles, also confirm J1939 compatibility. Many fleet telematics platforms and AIS 140-compliant systems still communicate over J1939. If your cluster cannot speak J1939, you will have integration problems downstream.

More on protocols: J1939 vs Analog Instruments — Key Differences

Q5. Are there Indian regulations specific to EV instrument cluster design?

Yes and this is an area where I see OEMs caught off guard more than anywhere else. The key frameworks to know:

  1. AIS 138 / AIS 049 — EV safety requirements including mandatory warning systems visible to the driver
  2. AIS 140 — mandatory GPS/GPRS telematics for commercial vehicles; must integrate with the cluster or gateway ECU
  3. CMVR Schedule X / XV — minimum display requirements for speed, odometer, and warning indicators across all vehicle categories including EVs

Always validate against the latest AIS revisions from ARAI. The EV-specific standards are still evolving, and what was current eighteen months ago may not reflect current homologation requirements.

Have questions about EV cluster architecture for your next platform? I welcome direct technical conversations. Reach out through indicationinstruments.com/contact-us/ — our engineering team is ready to help.

Related Posts from the Indication Instruments Blog

Multi-Function Digital Displays for Construction and Agricultural Equipment: Key Capabilities

Multi-Function Digital Displays for Construction and Agricultural Equipment: Key Capabilities

Multi-Function Digital Displays for Construction and Agricultural Equipment

Introduction: One Screen, A Machine’s Worth of Information

I attended an agricultural machinery exhibition a few years back where a single combine harvester had its cab redesigned around a large format multifunction display. The machine previously used eleven separate analog gauges and three toggle-monitored warning lights. The new setup consolidated everything into one configurable screen. A technician standing next to me, who had been servicing these machines for over two decades, looked at it for a moment and said: ‘That is the first time I have understood what a combine is actually doing just by looking at the dash.’

That observation has stayed with me because it captures what multifunction digital displays are supposed to accomplish. Not to add complexity, but to reduce it. Not to impress with features, but to give an operator a clear, prioritized view of a complex machine’s operational state.

The global agricultural equipment market is projected to reach USD 230 billion by 2027, according to Grand View Research. The construction equipment segment sits alongside it at approximately USD 215 billion. Both industries are in the middle of a significant digital instrumentation transition, driven by telematics integration requirements, emissions compliance monitoring, and the growing penetration of precision agriculture and job site management platforms. Multifunction digital displays are at the center of that transition.

This post examines what multifunction displays actually need to do in these applications, how construction and agricultural requirements differ from each other, and what technical specifications drive sound procurement decisions.

What Multi-Function Actually Means in Practice

The term multifunction gets applied loosely across the display market. Before any specification conversation, it is worth being precise about what the function set actually needs to cover.

Parameter consolidation: A multifunction display in a combine harvester or wheel loader needs to handle sensor inputs from the powertrain, hydraulic system, transmission, and cabin environment simultaneously. In a modern combine, that means 80 to 120 individual parameters are potentially displayable. The display needs the processing architecture to read all of them and the screen real estate to present the relevant ones intelligently.

Multi-network CAN capability: Agricultural and construction equipment routinely runs multiple CAN networks. The engine and powertrain typically operate on one network. Body and implement systems operate on another. An ISOBUS-connected implement adds a third. A display that can only read one CAN network will miss critical operational data in most professional applications.

Configurable display zones: Operators in different roles configure their information differently. A harvesting operator prioritizes grain yield, moisture content, and header height. A transport driver on the same machine prioritizes road speed and fuel level. A good multifunction display allows operator-defined configurations that switch contextually.

Alert prioritization and alarm management: The most important function of any multifunction display is making sure critical alerts are not lost in a sea of normal operating data. SAE J1939 defines severity classifications for diagnostic trouble codes. The display must respect those classifications and present critical alerts with appropriate urgency without rendering normal parameter displays unusable.

Indication Instruments’ range of

multifunction digital displays is engineered to handle these multi-network, multi-parameter requirements in the demanding environments that construction and agricultural equipment imposes.

Construction Equipment: What the Application Demands

Construction equipment encompasses a wide range of machine types, each with its own display requirements. Excavators, wheel loaders, motor graders, compactors, and articulated haul trucks share a common theme: they operate in outdoor environments with significant vibration, dust exposure, and variable lighting, and they are increasingly expected to feed data into job site management platforms.

The most consistent display requirement I hear from construction fleet operators is sunlight readability. A display that performs perfectly in a controlled environment becomes functionally useless when the machine is operating with the afternoon sun at a low angle through the cab windscreen. Minimum 1500 nit display brightness with anti-reflective cover glass treatment is a practical floor for serious outdoor construction applications.

Telematics integration for machine utilization reporting is the second most consistent requirement. Equipment rental companies and large contractors increasingly run centralized asset management platforms that need real time data on machine hours, fuel consumption, fault status, and GPS position. The multifunction display in the cab is the node through which telematics data becomes visible to the operator, and the TCU integration behind the display is what feeds the asset management platform. Specifying a display that supports TCU integration from the start avoids costly retrofit work later.

According to McKinsey, digital fleet management for construction equipment reduces equipment idle time by 15 to 25 percent. At the utilization rates and fuel consumption levels of large construction machinery, that reduction translates to meaningful cost recovery.

Agricultural Equipment: The ISOBUS Requirement

Agricultural equipment has a specific integration requirement that separates it from most other off-highway vehicle categories: ISOBUS. Defined by ISO 11783 and built on J1939 architecture, ISOBUS enables the tractor display to communicate directly with attached implements, showing implement-specific parameters and allowing operator control of implement functions from the cab display.

In practical terms, this means a seed drill attached to a tractor communicates its section control status, seed rate, blockage alarms, and actual application rate directly to the tractor’s multifunction display. A fertilizer spreader sends its application rate and GPS section status. A baler sends bale count and chamber pressure. Without ISOBUS capability in the display, all of this information is either inaccessible or requires separate implement-mounted displays, which fragment the operator’s attention and complicate the cabin ergonomics.

Precision agriculture is accelerating the data demands on these displays. Variable rate application systems, GPS guidance overlays, yield mapping integration, and field management platform connectivity are all capabilities that professional arable and livestock farmers now expect as standard in premium equipment. The multifunction display is the convergence point for all of it.

The global precision agriculture market is projected to reach USD 14.5 billion by 2027, according to MarketsandMarkets. That growth is being driven by the integration of GPS, sensor, and display technology that makes variable rate application and yield monitoring operationally practical. The display platform is the linchpin of that integration.

Key Capabilities by Equipment Type: A Comparison

The table below outlines the core multifunction display capabilities required across construction, agricultural, and mining equipment categories. Requirements vary more than product specifications typically acknowledge.

CapabilityConstruction EquipmentAgricultural EquipmentMining Equipment
Primary ProtocolJ1939, CANopenISOBUS (ISO 11783), J1939J1939, CANopen, proprietary OEM
Minimum Display Brightness1500 nits (outdoor operations)1500 nits (field operations)2000 nits (direct sun exposure)
Multi-Network CAN2 networks minimum3 networks (tractor + implement + GPS)3 to 4 networks standard
ISOBUS Task ControllerRarely requiredMandatory for implement controlNot applicable
Telematics IntegrationJob site management platformField management system, AgTech platformMine management and dispatch system
Data LoggingMachine hours, fuel, fault eventsYield data, application rates, GPS tracksPayload cycles, tyre pressure, downtime events
Alarm Management Levels3 tier (advisory, caution, critical)3 tier plus implement-specific warnings4 tier including safety interlock states
Operating TemperatureMinus 20 to plus 70 degrees CMinus 40 to plus 70 degrees CMinus 40 to plus 85 degrees C
GPS Overlay SupportJob site mapping (optional)Field boundary and guidance (standard)Haul route and pit mapping (required)

Technical Specifications That Drive Procurement Decisions

Screen size gets a lot of attention in display procurement conversations. It matters, but it is rarely the most important specification. The criteria that separate a display that works in an agricultural cab from one that fails at month six in the same application are environmental tolerance, protocol depth, and processing architecture.

Processing capacity: Multifunction displays need sufficient processing headroom to handle CAN message parsing, display rendering, alert processing, GPS data management, and telematics communication simultaneously. Displays that perform adequately in bench testing can suffer rendering latency or missed alarms when all subsystems are active simultaneously in a field environment. Asking for demonstrated performance under full load, not peak theoretical specifications, is the right evaluation approach.

Memory and data logging: Precision agriculture and construction telematics both depend on reliable local data logging when cellular connectivity is unavailable. A display that loses operational data because it lacks sufficient onboard storage defeats a significant part of its purpose in field applications. Ask for specific local storage capacity and logging interval specifications.

Connectivity options: Bluetooth pairing for operator configuration via tablet, Wi-Fi for job site hotspot connectivity, and cellular modem integration for real time fleet platform communication are all relevant connectivity requirements in modern equipment. Not every application needs all three, but understanding which connectivity modes the display supports natively versus requiring external hardware saves integration complexity.

Exploring the full product range at Indication Instruments is a practical starting point for construction and agricultural equipment programs where multifunction display specifications need to be matched to specific operational requirements.

Where This Technology Is Heading

Two developments are shaping the next generation of multifunction display deployments in construction and agricultural equipment.

Autonomous and semi-autonomous equipment is arriving in both sectors. Autonomous haul trucks are already operating in large surface mining sites. Autonomous tractors are in commercial deployment with multiple manufacturers. The instrument cluster in these machines shifts from an operator interface to a remote supervision and intervention interface. The display architecture, processing requirements, and connectivity demands of autonomous operation are substantially different from conventional operator-present applications. Display platforms selected for the next equipment generation need to be evaluated with that transition in mind.

Cloud integration for real time job site and field management is becoming a baseline expectation rather than a premium feature. Contractors and large farming operations increasingly expect live machine data in browser-based management platforms without manual data transfer. The multifunction display is the on-machine endpoint of that data pipeline. Its ability to connect reliably to cloud platforms via cellular or site Wi-Fi and transmit structured operational data determines the practical value of the broader management system.

Reach out to the team at Indication Instruments to discuss multifunction display specifications for your construction or agricultural equipment program.

Frequently Asked Questions

Q1: What is the difference between a multifunction display and a standard instrument cluster?

A standard instrument cluster displays a fixed set of vehicle parameters from a single data source. A multifunction display handles multiple data sources simultaneously, typically across more than one CAN network, and provides configurable display layouts that the operator can adjust based on operational context. In agricultural applications, this includes ISOBUS implement integration. In construction applications, it includes job site telematics data alongside machine operating parameters.

Q2: Is ISOBUS compatibility mandatory for all agricultural equipment displays?

ISOBUS is mandatory for any display intended to interface with modern precision agriculture implements, including GPS-guided sprayers, planters with section control, and yield-mapping harvesters. For simpler applications such as standalone tractors with non-ISOBUS implements, standard J1939 capability may suffice. The defining question is whether the application requires implement-specific parameters and control functions to appear on the tractor display.

Q3: What screen size is appropriate for agricultural and construction cab applications?

Seven to ten inch diagonal displays are the most common range for single-display cab installations in agricultural and construction equipment. Larger twelve to fifteen inch formats are increasingly used in premium tractors and graders where the cab space allows and the information density justifies the screen real estate. The more important specification is often pixel density and cover glass quality rather than physical size alone.

Q4: How does data logging work in remote field operations without cellular connectivity?

Quality multifunction displays include onboard storage, typically 8 to 32 GB of internal memory, for local data logging during field operations outside cellular coverage. When connectivity is reestablished, the display or an integrated telematics module transmits the buffered data to the fleet or field management platform. Evaluating the logging interval, buffer size, and transmission priority protocol is important for applications with extended periods of low connectivity.

Q5: What certifications should I require for a construction equipment multifunction display?

E-mark certification is required for equipment that will operate on public roads in European markets. CE marking is required for equipment sold in the EU. For off-highway construction applications, IP67 minimum for dust and water resistance and MIL-STD-810G or equivalent vibration testing are practical requirements. ISO 13766 specifically covers earthmoving machinery and is the most directly relevant vibration standard for construction equipment display procurement.

Q6: Where can I find multifunction displays suited to construction and agricultural applications?

Indication Instruments offers a range of digital display solutions engineered for the environmental and protocol requirements of construction and agricultural equipment. Visit the product catalog or contact the team for an application-specific recommendation.

Related Articles

  1. Advanced Digital Instrument Clusters for Heavy Duty Trucks and Industrial Vehicles
  2. SAE J1939 and ISOBUS Protocol Guide for Agricultural Equipment Engineers
  3. Digital Display Selection Guide for Industrial and Automotive Applications
  4. How Fleet Telematics Is Transforming Construction Site Management
  5. Rugged Instrument Clusters for Off-Highway Vehicles: Features and Benefits
How SCR System Works (And Why Def Quality Matters)

How SCR System Works (And Why Def Quality Matters)

How SCR System Works (And Why Def Quality Matters)

Modern diesel vehicles use Selective Catalytic Reduction (SCR) to cut NOx emissions (nitrogen oxides) in the exhaust. The core idea is simple:

  1. Exhaust leaves the engine carrying NOx.
  2. A dosing module injects DEF (Diesel Exhaust Fluid)—also called AdBlue in many markets—into the hot exhaust stream.
  3. DEF is an aqueous urea solution (nominally 32.5% urea in deionized water). In the exhaust, urea breaks down to form ammonia (NH₃).
  4. Inside the SCR catalyst, ammonia reacts with NOx and converts it into nitrogen (N₂) and water (H₂O).

If the system doses the right amount of DEF, at the right time, and the catalyst is healthy, NOx emissions drop dramatically.

Where the DEF quality sensor fits

The SCR controller assumes DEF has the correct urea concentration. If DEF is:

  • diluted with water,
  • contaminated, or
  • wrong fluid entirely,

then ammonia generation is off, dosing control becomes inaccurate, and NOx reduction suffers. That can lead to:

  • emissions non-compliance,
  • catalyst or dosing faults,
  • crystal deposits / clogging risks (from improper dosing and evaporation behaviour), and
  • repeated warning lamps / limp-home strategies.

So a DEF quality sensor is essentially an “input-truth” sensor: it verifies the fluid is what the ECU thinks it is, so the SCR system can function reliably across real-world usage.

Why DEF quality sensing is critical in BS6 vehicles

BS6 (Bharat Stage VI) tightened allowable emissions significantly, especially NOx for diesels, which pushed SCR adoption across many vehicle segments in India.

Regulations also require that emission control systems are not easily defeated or bypassed. In practice, that means vehicles must detect and respond to:

  • wrong / low-quality DEF,
  • empty tanks,
  • dosing malfunctions, and
  • emissions-control tampering.

Typical responses include warnings, inducements (e.g., reduced torque), and diagnostic trouble codes. That makes DEF quality sensing not just a performance feature but a compliance and durability necessity—because sustained NOx non-control can put the vehicle out of regulatory conformity.

Two main approaches to DEF quality sensing

Most DEF quality sensors aim to estimate urea concentration (and sometimes infer contamination) by measuring how the fluid interacts with light or sound. The two widely used families are:

  1. Optical sensing (often using refractive index / light transmission behavior)
  2. Ultrasonic sensing (using sound velocity / acoustic attenuation)

Both technologies exist because DEF is tricky:

  • It’s water-based, but not just water.
  • Concentration must be close to nominal for correct ammonia generation.
  • It can freeze, warm up, age, and pick up air bubbles or crystals.
  • The sensor sits in a harsh underbody environment: temperature cycling, vibration, contamination, chemical exposure, and connector issues.

How optical DEF quality sensing works

Principle (in simple terms)

Optical sensors shine light through or into the fluid and measure how it behaves—commonly through:

  • Refractive index (RI): how strongly the fluid bends light.
  • Transmission / absorption: how much light passes through at certain wavelengths.
  • Backscatter / reflection: how light reflects based on fluid properties.

Because urea concentration changes the optical properties of the solution, the sensor can estimate concentration when combined with temperature compensation.

Evolution: why optical became attractive

Optical methods matured fast due to:

  • Low-cost, robust LEDs and photodiodes
  • Better optical plastics, windows, and sealing methods
  • Compact opto-mechanical packaging suited to tank modules
  • Mature signal processing (filtering noise, compensating temperature and aging)

How it’s used in DEF quality sensing

A typical design has:

  • Light source (LED)
  • Optical path or prism/window contacting the DEF
  • Detector (photodiode)
  • Temperature sensor (very important)
  • Calibration curve mapping optical signal → concentration

How ultrasonic DEF quality sensing works

Principle (in simple terms)

Ultrasonic sensors send a high-frequency sound wave through the fluid and measure:

  • Speed of sound in the fluid (changes with concentration and temperature)
  • Attenuation (how quickly the sound weakens), which can also be influenced by bubbles and contamination
  • Sometimes time-of-flight and amplitude patterns

Because urea concentration changes density and compressibility, it changes the speed of sound—again requiring strong temperature compensation.

Evolution: why ultrasonic gained popularity

Ultrasonic sensing benefited from:

  • Better low-power piezo transducers
  • Improved timing electronics (precise time-of-flight measurement)
  • Automotive-grade digital processing
  • Strong packaging learning from ultrasonic parking sensors and flow meters

How it’s used in DEF quality sensing

A typical design has:

  • One or two ultrasonic transducers
  • A defined acoustic path length inside a chamber or across a sensor face
  • Electronics to measure time-of-flight and/or amplitude
  • Temperature sensor + calibration model

Advantages and limitations: Optical vs Ultrasonic

Optical sensing — advantages

  • High sensitivity to concentration changes (especially with refractive index methods)
  • Fast response
  • Can be compact with simple electronics
  • Often cost-effective at scale
  • Can be designed to be low power

Optical sensing — limitations

  • Window fouling / deposits: crystallization, films, or contamination on the optical surface can skew readings.
  • Aging of optics: LED output drift, photodiode sensitivity drift, yellowing of plastics over long life (depends on materials and design).
  • Bubbles / turbidity can disrupt the light path.
  • Needs good mechanical design to avoid false readings due to partial wetting, film formation, or trapped air.

Typical real-world failure modes: gradual signal drift due to optical path contamination, seal/window issues, connector ingress, or misreads during freeze/thaw transitions.

Read More: https://indicationinstruments.com/how-shingo-model-improves-product-quality-automotive-sensors/

Ultrasonic sensing — advantages

  • No “clear window” requirement in the same way as optical; can be less sensitive to surface staining.
  • Can be relatively robust to some forms of optical contamination/turbidity.
  • Speed of sound measurement can be very repeatable with good temperature compensation.
  • Can sometimes provide extra diagnostics (bubbles, aeration, fill state indicators) depending on implementation.

Ultrasonic sensing — limitations

  • Air bubbles are a big enemy: aeration can severely disturb ultrasonic transmission.
  • More sensitive to mechanical coupling and mounting: path length and alignment matter.
  • Electronics can be more complex (precise timing, signal conditioning).
  • DEF freezing and crystal formation can affect acoustic behavior near the sensor face.
  • In some designs, attenuation changes can be difficult to interpret uniquely (concentration vs bubbles vs contamination).

Typical real-world failure modes: intermittent readings from aeration, mounting stress, transducer aging, or edge-case errors during slosh/fill events and freeze/thaw.

Which technology is more preferred (especially considering warranty / failures)?

General industry tendency (practical view)

  • Optical can be excellent when the design strongly mitigates window fouling (good flow around the optical face, self-cleaning geometry, smart filtering/diagnostics). But if fouling is not controlled, optical drift leads to customer-visible issues (false poor quality, repeated warnings).
  • Ultrasonic avoids classic “dirty window” issues but is often more vulnerable to bubbles/aeration, which can be common during refills, return flow, and slosh—potentially causing intermittent faults if filtering and algorithms aren’t strong.

A practical recommendation for “warranty robustness”

  • If the vehicle duty cycle often includes frequent refills, slosh, and aeration, and the packaging cannot ensure stable fluid contact, optical may produce fewer intermittent faults (provided the optical surface is protected against deposits).
  • If the system historically struggles with crystal/deposit build-up at the sensor face or the tank environment is prone to contamination films, ultrasonic may be preferred due to reduced dependence on optical clarity—as long as the design handles bubbles well.

Best-practice design notes (what reduces failures for both)

Regardless of technology, the best warranty outcomes usually come from:

  • Strong temperature measurement and compensation (DEF properties vary heavily with temperature)
  • Freeze/thaw-aware algorithms (ignore readings during transition, confirm stability)
  • Debounced diagnostics (avoid triggering faults on short-term disturbances)
  • Mechanical design that ensures consistent wetting and minimizes trapped air
  • Service-friendly diagnostics (differentiate “bad DEF” vs “sensor issue” vs “aeration event”)

Closing: what the future looks like

As BS6 (and global) emission enforcement strengthens, DEF quality sensing is moving toward:

  • better multi-parameter sensing (concentration + contamination heuristics),
  • smarter diagnostics to reduce false warnings,
  • improved materials to fight deposits and long-term drift,
  • and designs that remain stable across harsh real-world conditions.

Optical and ultrasonic sensing are both proven. The “winner” is usually the one that best matches the tank hydraulics, packaging constraints, and diagnostic philosophy—not just the physics.

Error Proofing in Assembly Lines: Practical Examples That Actually Work

Error Proofing in Assembly Lines: Practical Examples That Actually Work

Error Proofing in Assembly Lines: Practical Examples That Actually Work

How Error-Proofing Slowly Removes the Need for Inspection?

In most factories, quality still depends heavily on inspection. We inspect incoming parts, inspect after every critical operation, inspect at the end of the line, and sometimes even inspect again before dispatch. On paper, this feels safe. In reality, it usually means the process itself is not fully trusted.

Automation was supposed to solve this problem. But in many automated lines, manufacturing Gauges, Instrument Clusters, and Digital Display systems inspection remains almost the same as before—just faster and more expensive. The real improvement in quality does not come from adding more inspection points. It comes from error-proofing the process so that mistakes simply cannot happen.

This blog talks about error-proofing in automated lines the way it is actually used on the shop floor, not the way it appears in presentations. These are practical examples that work, and more importantly, they explain why good error-proofing naturally reduces dependence on inspection.

Inspection exists because we expect something to go wrong. If the process were truly reliable, inspection would be minimal. But over time, inspection becomes a habit. When a defect occurs, the first reaction is often, “Add one more check.”

The problem with this approach is simple:

  • Inspection finds defects after they are already made
  • It depends on human attention and judgment
  • It slows down the line
  • It hides weak processes instead of fixing them

Anyone who has worked on the shop floor knows that even 100% inspection does not guarantee zero defects. Fatigue, pressure, and routine make mistakes inevitable.

Error-proofing takes a different approach. Instead of asking people to “be careful,” it changes the process so that being careless is no longer possible.

What Error-Proofing Really Means in Automation

Error-proofing in automated lines does not mean installing expensive vision systems everywhere. It means thinking ahead and asking one simple question at every step:

“How can this operation go wrong—and how can I stop it before it happens?”

Sometimes the solution is electronic. Sometimes it is mechanical. Often, it is just good logic in the PLC.

The best error-proofing solutions are usually:

  • Simple
  • Reliable
  • Hard to bypass
  • Easy to maintain

Also Read: Problem-solving that actually sticks: Practical techniques and why 8D works for us

Practical Error-Proofing Examples from Automated Lines

1. Part Presence and Orientation Checks

One of the most common causes of defects is wrong part loading or incorrect orientation. 

This is especially common in assembly of Gauges and Digital Display units, where alignment and connector placement must be perfect Operators may be trained, but in high-volume production, mistakes happen.

A simple sensor or vision check before cycle start can confirm:

  • Part is present
  • Part is in the correct position
  • Part is seated properly

If the condition is not met, the machine simply does not start.

This immediately removes the need for an operator or inspector to visually confirm the part. The machine takes responsibility, and the operator only responds if there is an alarm.

2. Forcing the Right Sequence

In manual or semi-automatic lines, operators sometimes skip steps—usually to save time, sometimes by mistake.

In a well error-proofed automated line, the sequence is locked. The next step is enabled only when the previous step is completed correctly and confirmed by a sensor or signal.

This means:

  • No step can be skipped
  • No step can be done twice
  • No step can be done out of order

Once this is in place, inspection for “missed operations” becomes unnecessary because the process itself guarantees completion.

3. Torque and Force Monitoring

Fastening and press-fit operations are sensitive and often responsible for major quality issues.

Instead of checking torque or fitment later, modern automated lines monitor:

  • Applied torque
  • Angle
  • Press force
  • Final position

If the values are outside limits, the system immediately flags the issue or stops the process.

This is far more reliable than checking bolts or fitment afterward. Numbers don’t lie, and machines don’t “feel” differently at the end of a long shift.

4. Position and Height Verification

Many defects happen because something is almost right, but not fully correct. A component looks fitted, but it is not seated fully.

Using simple height sensors, encoders, or probes, the machine can confirm:

  • Final height
  • Insertion depth
  • End position

Once this is validated automatically, there is no need for visual inspection at that station. The machine already knows whether the operation was successful.

5. Fixture and Clamp Interlocks

Running a machine without proper clamping or with a wrong fixture can damage parts, tools, or even cause safety incidents.

Limit switches and proximity sensors can confirm:

  • Fixture is present
  • Clamp is fully closed
  • Tool is correctly mounted

If any condition is not satisfied, the machine refuses to run. This eliminates reliance on operator attention and removes the need for pre-operation inspection.

6. Variant and Model Control

In multi-variant production, part mix-ups are a major risk. This is critical for products like Instrument Clusters and Digital Display models, where different variants require different configurations, Training alone is never enough.

Barcode or RFID systems allow the machine to verify:

  • Correct part number
  • Correct model
  • Correct program loaded

If there is a mismatch, the line stops immediately. This makes inspection for variant correctness almost irrelevant because the process itself blocks errors.

7. Rejecting Defects Immediately

One of the biggest weaknesses in many lines is allowing defects to move forward.

Effective error-proofing ensures that:

  • A defective part is rejected immediately
  • It cannot move to the next station
  • It cannot be mixed with OK parts

When defects are stopped at the source, end-of-line inspection and sorting reduce drastically.

How Error-Proofing Slowly Removes the Need for Inspection?

When error-proofing is done properly, something interesting happens over time. Inspection levels start reducing naturally.

This happens because:

  • The process becomes predictable
  • Defects stop repeating
  • Confidence in the line increases
  • Quality becomes stable, not reactive

Inspection then changes its role. Instead of checking every part, quality teams focus on:

  • Process audits
  • Trend analysis
  • Continuous improvement

Inspection becomes a confirmation, not a rescue activity.

Common Mistakes That We All Make

Many error-proofing attempts fail because:

  • Systems are over-engineered
  • Bypasses are easily available
  • Alarms are ignored
  • Maintenance is not involved
  • Detection is mistaken for prevention

True error-proofing does not just raise an alarm. It prevents the mistake from going further.

The Role of Process Engineers

Error-proofing is not the responsibility of machine suppliers alone. Process engineers play a key role by:

  • Studying past defects
  • Identifying weak steps
  • Converting inspection points into prevention points
  • Driving small but effective upgrades

Even one good error-proofing improvement every month can completely change the stability of a line.

Final Thoughts

Inspection will never disappear completely—and it shouldn’t. But when inspection becomes the main quality control method, it is a sign that the process needs improvement.

Error-proofing strengthens the process so that quality is built in, not checked in.

The best automated lines are not the ones with the most inspectors. They are the ones where nothing can go wrong unless something abnormal happens—and when it does, the system reacts immediately.

In the end, the strongest quality system is not the one that catches every defect, but the one that doesn’t allow defects to exist at all. Error-proofing is increasingly important in industries producing Gauges, Instrument Clusters, and Digital Display products, where reliability and accuracy are essential.

Frequently Asked Questions (FAQ)

Is error-proofing suitable only for fully automated assembly lines?

No. Error-proofing works in manual, semi-automatic, and fully automated lines. Simple solutions like interlocks, sensors, and sequence checks are often more effective than complex automation.

Can error-proofing completely eliminate inspection?

No. Inspection cannot be removed completely, but effective error-proofing greatly reduces the need for frequent and repetitive inspections by preventing defects at the source.

Is error-proofing expensive to implement?

Not necessarily. Many effective error-proofing solutions use simple sensors, mechanical guides, or PLC logic. These are often far cheaper than ongoing inspection, rework, and scrap costs.

How do you decide where to apply error-proofing first?

Start with processes that have repeated defects, high rework, or safety risks. Past quality data and operator feedback are the best inputs for identifying error-proofing opportunities.