Introduction: CAN Bus Is Not Plug and Play
One of the most persistent misunderstandings I encounter among engineers new to vehicle display integration is the assumption that CAN bus connectivity is straightforward. The protocol is mature, well-documented, and widely supported. The hardware is standardized. Surely connecting a display to a vehicle CAN network is a solved problem.
The global automotive CAN bus market is projected to reach USD 3.8 billion by 2026, according to MarketsandMarkets, reflecting the continued dominance of CAN as the primary in-vehicle communication standard across passenger, commercial, and industrial vehicle categories. Understanding what quality CAN bus integration looks like, and what it delivers for vehicle performance and operational visibility, is relevant to anyone specifying display systems for connected vehicle applications.
This post covers the fundamentals of CAN bus architecture as they relate to display integration, the specific performance benefits that CAN-based displays deliver over analog-sensor-wired alternatives, the common integration challenges, and how CAN fits into the broader picture of modern vehicle network architecture.
CAN Bus Fundamentals for Display Integration
CAN (Controller Area Network) was developed by Bosch in the early 1980s and standardized as ISO 11898. Its design was motivated by a need to reduce wiring complexity in vehicles while providing reliable, fault-tolerant communication between distributed electronic control units. Both goals remain as relevant today as they were forty years ago.
Message-based architecture: CAN is not a point-to-point communication system. Every node on the bus can hear every message broadcast by every other node. Each message has an identifier that defines both the message content and its arbitration priority. High-priority messages (with lower identifier values) win arbitration over lower-priority messages when two nodes attempt to transmit simultaneously. This deterministic arbitration behavior makes CAN predictable and real time capable in a way that many later network technologies have struggled to replicate at comparable cost.
High-speed and low-speed networks: CAN operates at data rates up to 1 Mbit/s (high-speed CAN per ISO 11898-2) for powertrain and chassis systems. A fault-tolerant low-speed variant (ISO 11898-3) operates at up to 125 Kbit/s and is used for body electronics where the physical fault tolerance justifies lower performance. Most vehicles run both, connected through gateway ECUs that translate messages between network segments as required.
CAN FD: Controller Area Network with Flexible Data rate is the evolution standard that increases payload size from 8 bytes to 64 bytes and raises maximum data rate to 5 Mbit/s for the data phase. CAN FD is increasingly appearing in premium passenger vehicles and new commercial vehicle platforms where larger payload requirements from ADAS and OTA update use cases exceed the original CAN frame limits. Display hardware specified for new vehicle programs should confirm CAN FD compatibility if the vehicle platform has adopted it.
How CAN Integration Gets Vehicle Data to the Display
A digital display connected to the CAN bus reads message frames from the bus, maps each frame’s identifier to a known parameter definition (typically a J1939 PGN or OEM-specific identifier), extracts the parameter value from the frame’s data payload per the applicable encoding specification, applies scaling and offset factors to convert the raw value to engineering units, and passes the result to the display rendering engine.
This process happens for every parameter displayed, at the update rate at which each parameter is published on the bus. A display showing 80 parameters simultaneously is parsing and rendering 80 separate CAN data streams. The processing architecture of the display’s system on chip determines whether it can handle that workload without latency or dropped updates.
PGN mapping and configuration: In J1939 applications, each parameter group has a standardized PGN that the display must be configured to recognize. Most industrial display platforms include a default J1939 PGN library. However, OEM-specific proprietary PGNs that carry vehicle-specific parameters not covered by the standard specification require custom configuration. Confirming that the display platform supports custom PGN configuration, not just the standard library, is an important specification check.
Display update rate alignment: Each CAN parameter has an appropriate display refresh rate aligned to its physical behavior. Speed should update at 20ms intervals for smooth analogue-style needle movement. Coolant temperature at 200ms is entirely adequate given the thermal time constants of the system. Aligning display refresh rates to CAN message rates avoids unnecessary processing overhead and prevents visible stepping in continuously varying parameters.
Performance Benefits of CAN-Based Display Integration
The shift from direct-wired analog sensors to CAN-based display integration delivers measurable performance improvements across several dimensions.
| Performance Dimension | Analog Sensor Wiring | CAN Bus Integration | Improvement |
|---|---|---|---|
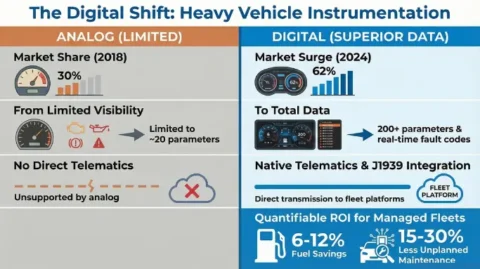
| Parameter Count | 15 to 25 (wire-limited) | 60 to 200+ parameters | Up to 10x more data visible |
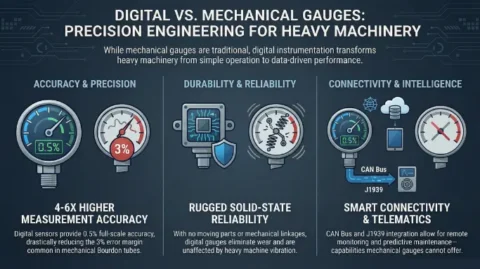
| Measurement Accuracy | Plus or minus 3 to 5% typical | Plus or minus 0.5 to 1% (ECU processed) | 3 to 5x accuracy improvement |
| Wiring Harness Complexity | Individual wire per sensor | 2 wire differential bus, all parameters | Major wiring reduction |
| Fault Code Visibility | No fault code display possible | Real time DTC display from J1939 | Full diagnostic transparency |
| Sensor Failure Detection | Voltage out of range only | CAN timeout and message error flags | More precise fault isolation |
| OTA Configuration | Not applicable | Parameter configuration via CAN message | Remote display configuration possible |
| Fleet Telematics Integration | Not supported natively | Direct TCU integration via shared bus | Fleet visibility enabled |
| Display Installation Effort | High: multi-wire harness routing | Low: 2 bus wires plus power and ground | Significant installation cost saving |
| Bus Load Contribution | None | 1 to 5% typical for display node | Negligible network impact |
Common Integration Challenges and How to Address Them
CAN bus integration in digital displays is a solved engineering problem when approached with the right preparation. The challenges that cause the most field problems are consistently the same ones, and they are consistently avoidable.
Bus termination errors: CAN bus requires a 120-ohm resistive termination at each end of the bus cable. Missing or incorrect termination causes signal reflections that corrupt message frames at high bus utilization. A simple termination resistance check with a multimeter across the bus differential pair (target: 60 ohms for a correctly terminated bus) catches termination errors before they cause field failures.
Message ID conflicts: When a display node is added to an existing CAN network, its messages must not use identifiers already assigned to existing nodes. In J1939 networks, address claiming procedures manage this. In proprietary CAN networks, a bus traffic capture using a CAN analyzer tool before integration reveals the existing ID assignments. Installing a display that conflicts with existing ECU IDs can cause intermittent network errors that are difficult to trace.
CAN bus load management: A display that requests parameter data by transmitting request frames adds to the bus traffic load. A CAN bus running above 70 percent utilization begins to experience message arbitration delays that cause late or missing updates. Specifying a display that listens to broadcast data rather than generating requests, and confirming bus utilization at peak load with a CAN analyzer, prevents load-related display latency in dense ECU environments.
Ground potential differences: CAN differential signaling is robust to common-mode noise, but large ground potential differences between the display and other CAN nodes can push the bus signals outside the receiver’s common-mode input range. Single-point grounding of all CAN bus nodes to a common chassis ground reference eliminates the most common source of this problem in vehicle installations.
For programs where CAN integration reliability is a primary concern, the engineering support team at Indication Instruments has the field integration experience to help identify and resolve common challenges before they reach the production stage.
CAN in the Modern Vehicle Network Architecture
CAN remains the dominant in-vehicle network protocol and will remain so across the majority of commercial and industrial vehicle categories for the foreseeable future. Its combination of robustness, determinism, low cost, and universal ECU support make it difficult to displace in applications that do not require the bandwidth of Automotive Ethernet.
Automotive Ethernet (100BASE-T1 and 1000BASE-T1) is increasingly used in high-bandwidth applications: camera feeds for ADAS, large OTA update file transfers, and high-resolution display video streams. These are the specific use cases where CAN’s bandwidth ceiling becomes a constraint. In the foreseeable future, most commercial and industrial vehicle networks will be hybrid architectures: Automotive Ethernet for high-bandwidth subsystems, CAN for the real time control and sensor communication where its determinism and robustness are most valuable.
Digital displays in these hybrid architectures will need to handle both protocol types. Evaluating candidate display platforms for multi-protocol capability, specifically the ability to parse CAN parameters and render Ethernet-sourced video or data simultaneously, is relevant for vehicle programs targeting 2025 and beyond.
Explore CAN-ready digital display solutions at Indication Instruments for a range of options suited to commercial and industrial vehicle CAN integration requirements.
Frequently Asked Questions
Q1: What is the maximum number of nodes that can be connected to a single CAN bus?
ISO 11898 specifies a theoretical maximum of 32 nodes on a single CAN network segment at full 1 Mbit/s speed. In practice, bus termination and cable impedance characteristics affect the practical maximum. Networks with more nodes are typically segmented using gateway ECUs that bridge between bus segments. A digital display connected as a passive listener (reading broadcast messages without generating requests) contributes minimal load and does not meaningfully constrain the node count on most commercial vehicle networks.
Q2: What is the difference between J1939 PGN configuration and OBD-II PID support?
J1939 PGNs define structured data messages carrying multiple parameters per frame, with standardized message identifiers and data encoding defined by the SAE J1939 specification. OBD-II PIDs are single-parameter diagnostic queries sent to the vehicle’s diagnostic connector and responded to by the relevant ECU. J1939 is the native bus protocol for commercial vehicles. OBD-II is a diagnostic access layer typically used by external devices connecting to the vehicle via the diagnostic port.
Q3: Can a display connected to the CAN bus affect vehicle network performance?
A passively listening display node contributes no transmit load to the bus. A display that actively transmits, for example sending request frames for specific parameters, contributes to bus load. A well-designed display in a J1939 application subscribes to broadcast data rather than generating individual parameter requests, keeping its bus load contribution below 2 percent in typical commercial vehicle networks.
Q4: How does CAN bus integration compare to Modbus for industrial equipment applications?
CAN is the preferred protocol for vehicular applications because of its multi-master broadcast architecture, deterministic message prioritization, and automotive-grade component ecosystem. Modbus is a widely used industrial protocol for stationary machinery and process equipment, operating on RS-485 physical layers. For off-highway vehicles, J1939 over CAN is the appropriate standard. Modbus may appear in some specialized industrial attachments or older telematics equipment but is not a native vehicle communication protocol.
Q5: What tools do I need to validate CAN bus integration for a digital display?
A CAN bus analyzer tool, such as the Peak PCAN-USB or Vector CANalyzer, is essential for capturing and analyzing bus traffic before and after display integration. It allows verification of message ID assignments, bus load measurement, and monitoring of message timing and error rates. For J1939 applications, a J1939-aware analysis tool that decodes PGNs is significantly more useful than a raw frame analyzer.
Q6: Where can I find digital displays with robust CAN bus integration for vehicle applications?
Indication Instruments offers a range of digital display and instrumentation solutions with verified CAN bus integration capability for J1939, CANopen, and OBD-II applications. The team can support both specification and integration validation.
Related Articles
- The Importance of Sensor Integration in Modern Vehicle Instrument Clusters
- The Role of Instrument Clusters in Connected Vehicle Ecosystems and Telematics Integration
- SAE J1939 Protocol Guide: What Fleet Engineers Need to Know
- Advanced Digital Instrument Clusters for Heavy Duty Trucks and Industrial Vehicles
- How Modern Instrument Clusters Improve Driver Awareness and Vehicle Diagnostics

Chief Technology Officer, Indication Instruments Ltd.
Anuj Garg has led the engineering and product development function at Indication Instruments for more than 2 decades, overseeing the design and manufacture of instrument clusters, sensors, and driver information systems for ICE and EV platforms across two-wheeler, commercial vehicle, and off-road segments. He has hands-on experience with cluster architecture for BS6 commercial vehicles, electric 3-wheelers, fleet applications, heavy vehicles, farm equipments, and leads the company’s technology roadmap.
LinkedIn: Anuj Garg