Powered by Smartsupp Anuj Garg, Author at Indication Instruments Ltd.
What Is a Tachometer and How Does It Work in a Vehicle?
What Is a Tachometer and How Does It Work in a Vehicle?

ddd

What Is a Tachometer and How Does It Measure Engine RPM?

A tachometer is the gauge on a dashboard — or panel, for stationary equipment — that tells you how fast an engine’s crankshaft is turning, measured in revolutions per minute (RPM). It reads an input signal from the engine, filters it, and converts it into a pointer position or digital display. Anyone who has watched the needle climb as they press the accelerator has been reading a tachometer.

Tachometer: The Short Answer

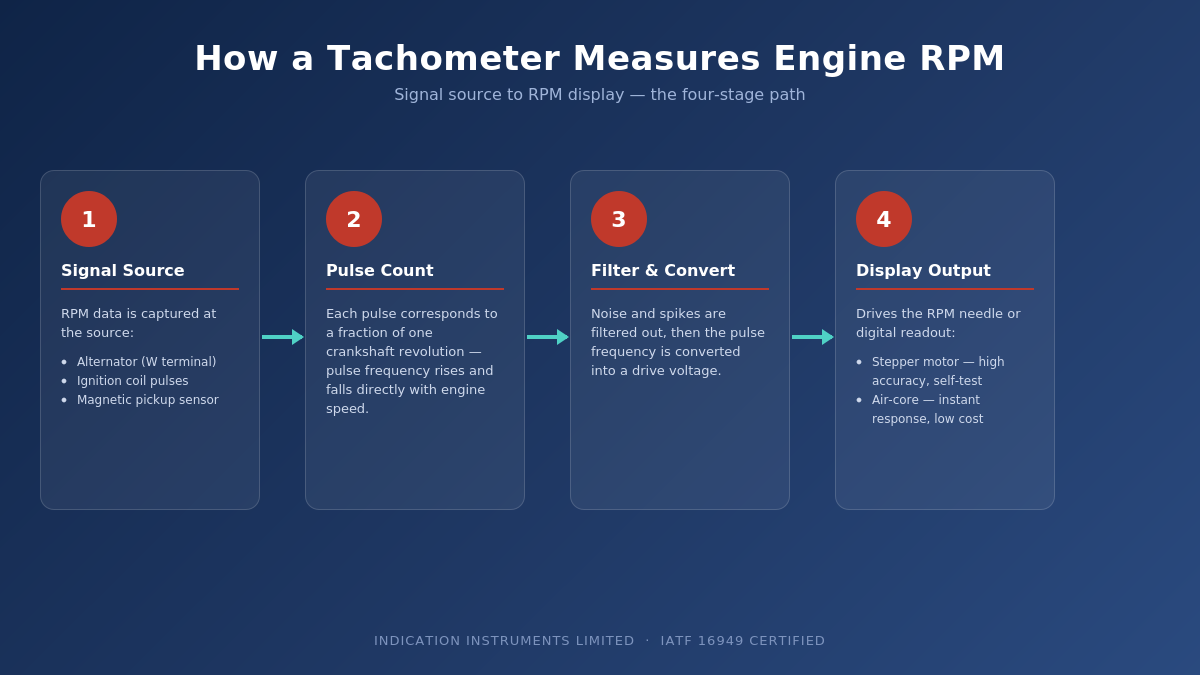
A tachometer measures engine RPM — how fast the crankshaft (or, in a genset or motor, the driveshaft) is rotating. It takes its input from a source like the alternator, ignition coil, or a magnetic pickup sensor, and converts that signal into a real-time RPM reading, whether on a needle-and-dial display or a digital screen.

Why Tachometers Matter in a Vehicle or Engine

In a moving vehicle, a tachometer helps the driver avoid over-revving, choose the right moment to shift gears, and drive in a way that protects fuel efficiency and engine life. In performance and racing applications, it does the opposite job just as usefully — showing exactly how close the engine is to redline. In stationary equipment such as generators and compressors, it becomes a preventive-maintenance tool: an RPM trend that drifts out of its normal band can be an early sign of a clutch, transmission, or load issue, well before it becomes a failure.

How Does a Tachometer Work? Mechanical vs Electronic

Tachometers fall into two broad categories based on how they get their input. Mechanical tachometers use a physically rotating flexible cable connected to the engine — an older technology, now largely phased out of new vehicle programs.

Electronic tachometers are the standard today, and split further into two types: those that accept analog signals, and those that accept digital signals. Analog signals arrive as frequency — from the alternator, crankshaft, or ignition system — get filtered to remove noise and spikes, and are converted into a voltage that drives either an air-core/stepper-motor pointer or a digital display. Digital inputs, such as a J1939 output, need minimal filtering and convert to that same drive voltage with typically higher accuracy.

What Signal Sources Does a Tachometer Read?

  • Alternator — input is taken from the W terminal on the stator winding; pulses per revolution depend on the alternator’s pole count and the pulley-diameter ratio between alternator and engine. Accuracy can drop if the connecting belt slips.
  • Ignition coil — in spark-ignition engines, the coil’s primary or secondary circuit produces a sharp voltage pulse for every ignition event, which the tachometer counts and converts to RPM.
  • Magnetic pickup sensor — generates sinusoidal pulses as gear teeth pass by, directly proportional to RPM; this is the standard source for diesel engines, which have no ignition coil to read from.

Where Are Tachometers Used? Mobility & Non-Mobility Applications

Indication Instruments Limited manufactures tachometers for both mobility and non-mobility applications — anywhere a petrol or diesel engine is running. On the mobility side, that spans on-road applications like specialty vehicles, hot rods, trucks, and buses, plus off-road applications such as farm tractors and construction equipment. On the non-mobility side, it covers stationary equipment like generators and compressors, and other IC-engine-driven machinery where RPM monitoring works alongside our broader range of gauges to support both operation and maintenance.

Stepper Motor vs Air-Core Tachometers: Which Is Right for Your Application?

Stepper-motor tachometers are driven by digital pulses from a microcontroller, delivering high accuracy — typically within about 2% — along with self-test capability such as a full-scale sweep at startup. They respond slightly slower and cost more to build.

Air-core tachometers use electromagnetic deflection to move the pointer directly, giving near-instant needle response at a lower cost and a long service life, with moderate accuracy (around 4%) that can drift slightly over time, and no built-in self-test.

Which one makes sense depends on the application: performance and safety-critical instrumentation tends to favour stepper-motor accuracy; cost-sensitive, high-volume programs often favour the simplicity of air-core.

Suggested alt text: “Stepper motor vs air-core tachometer comparison — accuracy, response, and cost.”

Tachometer vs Speedometer: What’s the Difference?

A tachometer measures engine RPM directly; a speedometer measures the vehicle’s wheel RPM and converts it into road speed. The two numbers move together but are never identical, because gearbox and differential ratios sit between the engine and the wheels — that’s also why a tachometer stays useful in stationary equipment with no wheels at all. For the full breakdown, see our companion guide: Odometer vs Speedometer: Key Differences.

Sourcing Tachometers for OEM Vehicle & Genset Programs

Specifying a tachometer for a new vehicle or equipment platform comes down to matching signal source, actuation type, and display format to the application — a diesel truck reading a magnetic-pickup signal has very different requirements from a genset panel reading an alternator signal. Indication Instruments Limited designs and manufactures both analog and programmable electronic tachometers for OEMs across India, built under IATF 16949 quality standards for trucks, buses, tractors, construction equipment, and gensets. Explore our instrument cluster range or talk to our engineering team about a custom RPM instrumentation specification.

Frequently Asked Questions

What does a tachometer measure?

Engine RPM — the rotational speed of the crankshaft (or a driveshaft, in stationary equipment), displayed as revolutions per minute.

How does a tachometer work in a car?

It reads a signal from the alternator, ignition coil, or a magnetic pickup sensor, filters it, and converts it into a needle position or digital RPM reading in real time as the engine speed changes.

What is the use of a tachometer?

It helps drivers avoid over-revving and choose optimal gear-shift points, helps performance drivers track how close the engine is to redline, and helps maintenance teams on stationary equipment spot abnormal RPM trends before they become failures.

Can an hourmeter be integrated into a tachometer?

Yes — commonly through a digital display (LCD or mechanical figure wheels). Mechanical figure wheels are older technology but keep the hourmeter reading visible even without power.

Why do some EVs have a tachometer even without an internal combustion engine?

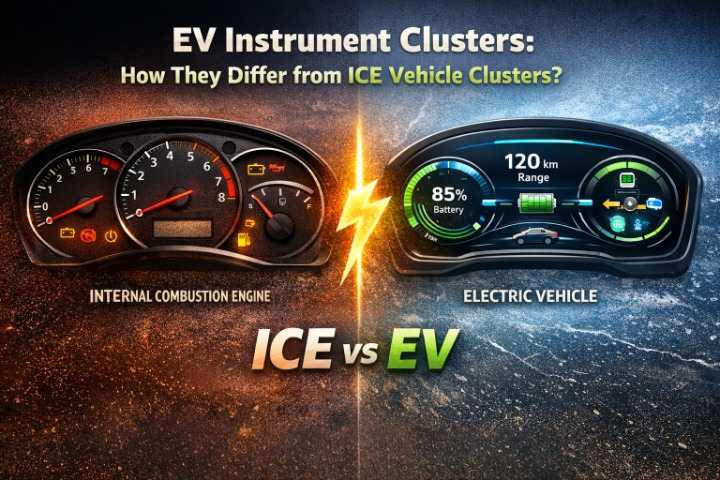
Some EVs include a tachometer-style gauge to monitor drive-motor speed instead of engine RPM. Since electric motors are less mechanically critical to overall vehicle health than an IC engine, this is more of a driver-feedback feature than a core diagnostic one.

Why don’t three-wheelers with IC engines usually have a tachometer?

Three-wheelers are built to a very low cost point, and a tachometer is typically one of the first instruments a program cuts to hit that price target — even though the engine technology would otherwise support one.

How do you calculate the full-scale frequency for a tachometer?

Full-scale Hz = (pulses per revolution × full-scale RPM) ÷ 60. Pulses per revolution depends on the source: number of flywheel teeth for a magnetic pickup, (poles × engine pulley diameter) ÷ (2 × alternator pulley diameter) for an alternator, or number of cylinders ÷ 2 for an ignition-coil input.

 

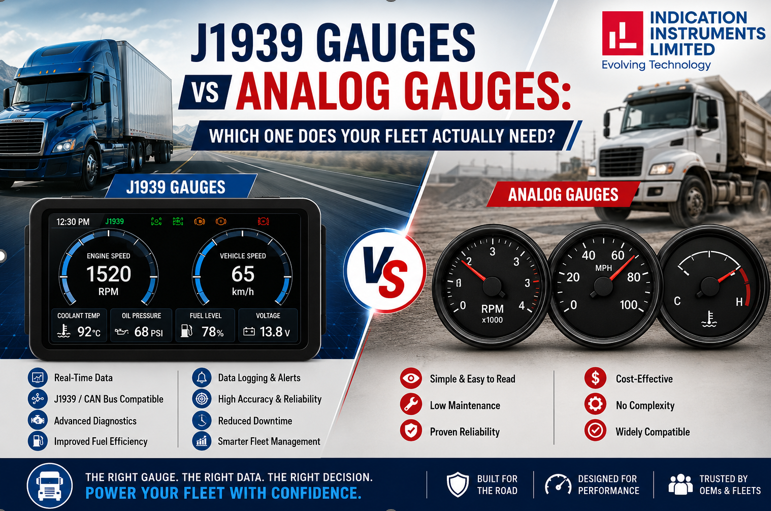
J1939 Gauges vs Analog Gauges: Which One Does Your Fleet Actually Need?

J1939 Gauges vs Analog Gauges: Which One Does Your Fleet Actually Need?

J1939 VS Analog

J1939 Gauges vs Analog Gauges: Which One Does Your Fleet Actually Need?

If you spec dashboards for trucks, buses, tractors, gensets, or construction equipment, you’ve probably hit this fork in the road: do you go with a J1939 digital gauge cluster that reads straight off the CAN bus, or stick with a proven analog/electrical gauge wired to a dedicated sender? It’s one of the most common questions OEM engineers, fleet maintenance heads, and equipment integrators search for — and the “right” answer depends less on which technology is newer and more on what your platform, budget, and service network actually look like.

This guide breaks down both options in plain terms, compares them side by side, and gives you a framework for deciding — whether you’re designing a new vehicle platform from scratch or retrofitting an aging fleet.

What Is a J1939 Gauge, in Practical Terms?

SAE J1939 is the communication protocol that lets an engine, transmission, brake system, and dashboard on a heavy-duty vehicle talk to each other over a single shared data network (built on CAN bus). Instead of running a separate physical sender wire from the fuel tank, the oil pan, and the coolant jacket to three different gauges, a J1939 gauge simply listens to the relevant messages already broadcasting on the bus and displays them.

For fleets, this matters for three practical reasons:

Fewer wires, fewer failure points. One data network can feed speed, RPM, temperature, fuel, and voltage to a single cluster instead of a bundle of dedicated sender circuits.

Standardized across brands. A J1939-compliant cluster can be used across different engine and chassis combinations, which is valuable if your fleet mixes makes and models.

Built-in diagnostics. Fault codes and warning states can be pulled from the same bus that feeds the gauge, so the dashboard doubles as a basic diagnostic display.

What Is an Analog / Electrical Gauge, and Why Is It Still Widely Used?

Analog and electrical gauges — air-cored, mechanical, or electrical types — take a direct physical reading from a sender (a thermistor for temperature, a variable resistor for fuel level, a pressure switch for oil) and move a needle accordingly. There’s no protocol translation involved; the sender’s signal drives the gauge directly.

They remain the default choice in a large share of trucks, gensets, compressors, and construction machines for a few reasons:

Lower unit cost, which matters on high-volume, price-sensitive platforms.

Simple to diagnose in the field — a technician with a multimeter can usually trace a fault without a laptop or diagnostic scanner.

No dependency on ECU software or bus wiring quality, which can be an advantage on older equipment or in markets where CAN-capable service infrastructure isn’t yet widespread.

J1939 vs Analog Gauges: Side-by-Side

Factor

J1939 Digital Gauge

Analog / Electrical Gauge

Wiring complexity

Low (single bus connection)

Higher (dedicated sender wire per gauge)

Diagnostics

Built-in fault codes, live data

Needs separate diagnostic tools

Cross-platform use

High — works across compliant ECUs

Depends on matching sender specs

Upfront cost

Generally higher

Generally lower

Field serviceability

Requires bus/protocol knowledge

Familiar to most mechanics

Best fit

Mixed fleets, telematics-integrated platforms, modern heavy-duty trucks

Budget builds, older equipment, simple gensets/compressors

How to Decide: Three Common Buyer Scenarios

You’re an OEM building a new heavy-duty truck or bus platform. If the engine ECU is already J1939-compliant (most modern diesel engines are) and you’re planning to add telematics or fleet-monitoring down the line, a J1939 gauge cluster reduces wiring harness complexity and future-proofs the dashboard for connected features.

You manage a mixed fleet with vehicles of different ages. A hybrid approach is common here — J1939 clusters on newer trucks, analog or electrical gauges on legacy equipment where a CAN-compliant ECU isn’t present. Retrofitting older machines with full J1939 clusters rarely makes financial sense unless the ECU already supports it.

You’re speccing gensets, compressors, or basic construction equipment on a tight budget. Analog and electrical gauges (temperature, pressure, ammeter) are usually the more practical choice here — lower cost, easy field repair, and no dependency on bus wiring quality in dusty or vibration-heavy environments.

A Quick Word on Hybrid and Multi-Function Options

You don’t always have to choose one or the other for an entire dashboard. Many fleets combine a J1939 speedometer or tachometer (fed by the engine ECU) with simpler electrical gauges for fuel or temperature, especially when only part of the system is bus-enabled. Multi-function gauges that combine fuel, pressure, and voltage on a single display are also worth considering when panel space is tight — they cut down on the number of physical gauges without requiring a full CAN retrofit.

Where Indication Instruments Fits In

Whichever way you land on the J1939-versus-analog question, the underlying build quality of the gauge matters just as much as the protocol behind it. Indication Instruments Limited manufactures both J1939-compliant digital gauges and traditional analog/electrical gauges — speedometers, tachometers, fuel gauges, temperature gauges, pressure gauges, ammeters, and hour meters — engineered to hold up under continuous vibration, dust, and temperature swings across trucks, buses, tractors, gensets, compressors, and construction sites. For OEMs and fleet buyers comparing options side by side, the full lineup of Gauges for Trucks, Construction Equipment, and Industrial Applications — including programmable, multi-function, and legacy variants — is laid out on one page, making it easy to match a gauge type to your platform’s exact wiring and protocol needs.

Frequently Asked Questions

Is J1939 always better than analog for a truck dashboard? Not necessarily. J1939 reduces wiring and adds diagnostics, but analog gauges are cheaper and easier to service in the field. The right choice depends on whether your ECU is already J1939-compliant and how your fleet plans to use the data.

Can J1939 and analog gauges be used on the same dashboard? Yes. It’s common to mix bus-fed gauges (like speed and RPM) with dedicated sender-based gauges (like fuel or temperature), especially during a partial upgrade.

Do older vehicles support J1939 gauges? Only if the engine ECU broadcasts J1939 messages. If it doesn’t, an analog or electrical gauge with a matching sender is usually the more reliable option.

What voltage do these gauges typically run on? Most heavy-duty gauges, whether J1939 or analog, are built to run on both 12V and 24V systems, making them compatible with a wide range of trucks, tractors, and machinery.

Are analog gauges being phased out? No — they’re still widely specified on gensets, compressors, and cost-sensitive equipment where simplicity and field repairability matter more than integrated diagnostics.

Digital Gauges vs Mechanical Gauges in Heavy Machinery: A Technical Comparison

Digital Gauges vs Mechanical Gauges in Heavy Machinery: A Technical Comparison

Digital Gauges vs Mechanical Gauges in Heavy Machinery: A Technical Comparison

Introduction: Why the Gauge Choice Is Really a System Design Choice

A few years ago, I spent an afternoon in a hydraulic system test cell comparing readings from a legacy mechanical Bourdon tube pressure gauge and a digital pressure transducer connected to a display module, both measuring the same hydraulic circuit simultaneously. The mechanical gauge was reading 3.8 bar when the transducer was showing 3.6 bar. The transducer was right. We confirmed it with a calibrated reference. The mechanical gauge, which had been in service for eleven years, had developed a calibration error of approximately five percent.

The facility maintenance team was surprised. The gauge looked fine. The needle moved smoothly. No one had flagged it as a problem. It had simply drifted, as mechanical gauges do, without any visible indication that its readings were no longer accurate.

That afternoon crystallized something I had seen across many heavy machinery applications: the choice between digital and mechanical gauges is not really a choice between display technologies. It is a choice between measurement philosophies. Mechanical gauges are direct-reading devices that convert physical force into mechanical movement. Digital gauges are signal processing chains that convert physical measurements into digital values, process them, and render them on a display. Each approach has distinct accuracy, reliability, integration, and lifecycle characteristics that make one or the other more appropriate depending on the application.

This post covers both technologies honestly, including their respective limitations, and provides the comparison framework that should drive gauge selection decisions in heavy machinery applications.

How Mechanical Gauges Work and Their Inherent Limitations

Understanding the mechanical gauge’s strengths and weaknesses starts with understanding its operating principle. The most common mechanical gauges used in heavy machinery fall into three categories.

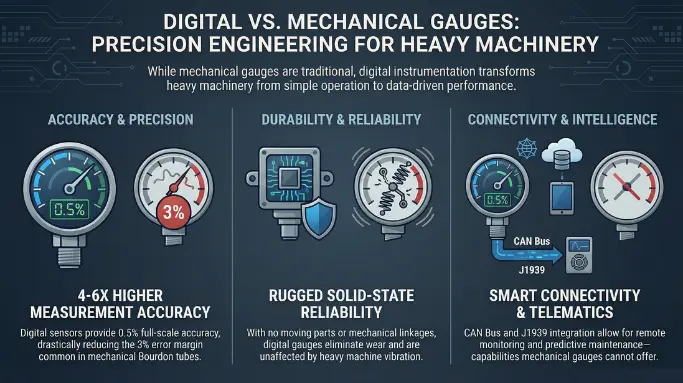
Bourdon tube pressure gauges: A curved metal tube sealed at one end. When pressure is applied to the open end, the tube tends to straighten. This straightening motion is transmitted through a mechanical linkage to a rotating indicator needle. The gauge requires no power source and its reading is directly proportional to the applied pressure. Its accuracy is typically specified as plus or minus 2 to 3 percent of full scale per EN 837 or ASME B40.100, and it maintains that accuracy when new and properly installed.

Bimetallic strip temperature gauges: Two metals with different coefficients of thermal expansion bonded together. When temperature changes, the differential expansion causes the strip to bend, driving a needle movement. Bimetallic gauges are used for lower-accuracy temperature monitoring in applications where the primary requirement is a go or no-go indication rather than a precise measurement.

Mechanical tachometers: Cable-driven or magnetic reluctance devices that convert shaft rotational speed into needle deflection. The mechanical connection between the rotating shaft and the needle introduces both wear over time and a response lag that makes reading transient RPM changes less precise than electronic alternatives.

The fundamental limitations of mechanical gauges follow from their physical operating principles. Mechanical linkages wear over time, introducing backlash and hysteresis that degrade accuracy. Vibration in heavy machinery applications causes needle oscillation that makes precise reading difficult. Temperature effects on the gauge mechanism itself can cause reading errors distinct from any error in the measured parameter. And critically, there is no output signal. A mechanical gauge reading cannot be logged, transmitted to a telematics platform, or used to trigger an automated alarm. It exists only as a local visual indication.

How Digital Gauges Work

A digital gauge system consists of an electronic sensor (the measurement element), a signal conditioning circuit, a processing unit that converts the sensor signal to a calibrated engineering value, and a display element. In modern vehicle and machinery applications, the processing and display functions are typically handled by the instrument cluster or display module, while the sensor itself is mounted at the measurement point.

Pressure transducers: Most digital pressure measurement uses piezoresistive silicon strain gauge sensors bonded to a diaphragm. Applied pressure deflects the diaphragm, changing the resistance of the strain gauges in a Wheatstone bridge configuration. The bridge output is amplified and processed by signal conditioning electronics to produce a calibrated 4 to 20mA, 0.5 to 4.5V, or CAN output signal proportional to pressure. Accuracy specifications are typically plus or minus 0.5 percent or better of full scale, significantly better than a comparable mechanical gauge.

Temperature sensors: NTC (Negative Temperature Coefficient) thermistors and PT100/PT1000 resistance temperature detectors (RTDs) are the most common digital temperature sensing elements in heavy machinery applications. NTC thermistors provide high sensitivity with a non-linear resistance-temperature characteristic that ECU calibration tables compensate. RTDs provide a more linear response with higher accuracy, typically plus or minus 0.1 degrees C, suited to precision temperature monitoring in critical fluid circuits.

Digital tachometers: Magnetic reluctance or Hall effect sensors count teeth on a gear wheel or pulses from a target wheel mounted to the rotating shaft, producing a frequency output that is digitally converted to a precise RPM value. Response time is limited only by the pulse count rate, making digital tachometers far more responsive to transient RPM changes than any mechanical alternative.

Accuracy and Reliability: A Direct Comparison

The performance difference between modern digital gauges and mechanical alternatives in heavy machinery applications is quantifiable and significant.

Performance Criterion

Mechanical Gauge

Digital Gauge

Advantage

Initial Accuracy

Plus or minus 2 to 3% of full scale

Plus or minus 0.25 to 0.5% of full scale

Digital: 4 to 6x better

Long-Term Accuracy Drift

Significant: mechanism wear and fatigue

Minimal: solid-state sensor, no moving parts

Digital: much more stable

Vibration Resistance

Needle oscillation, spring fatigue

Digital filtering, no mechanical movement

Digital: unaffected by vibration

Temperature Effect on Reading

Gauge mechanism errors with ambient temp

Compensated in signal conditioning

Digital: temperature compensated

Response Time

Mechanical lag: 200 to 500ms

Signal processing: 10 to 50ms

Digital: 5 to 10x faster

Calibration Interval

Typically 12 months or less in vibration

Every 2 to 5 years for quality sensors

Digital: longer service interval

CAN Bus Output

Not possible (no electrical output)

Standard output for J1939 integration

Digital only

Remote Monitoring

Not possible

Full telematics integration capable

Digital only

Failure Mode Visibility

Gauge can drift without visible indication

Out-of-range and sensor fault detection

Digital: self-diagnostic capability

MTBF in Vibration Environments

5,000 to 15,000 hours (mechanism wear)

50,000 hours or greater (solid state)

Digital: dramatically longer

Integration Capability: Where Digital Transforms Operations

The most transformative advantage of digital gauges in heavy machinery applications is not accuracy. It is connectivity. A mechanical gauge is a local display with no downstream data capability. A digital gauge with a CAN bus output is a data source for every system in the vehicle’s information architecture.

Fleet telematics and remote monitoring: Digital pressure, temperature, and speed sensors connected to a CAN bus feed their readings into the vehicle’s telematics stream. A fleet manager monitoring 50 excavators can see the hydraulic oil temperature on every machine simultaneously, flag machines approaching thermal stress limits, and dispatch maintenance before a failure occurs. This visibility is simply not possible with mechanical gauges.

Automated alarm and interlock systems: Digital sensor outputs can trigger automated alarms when parameter thresholds are crossed, even when no operator is present. Machinery in automated or semi-automated operating modes, such as autonomous mining haul trucks or remotely supervised processing equipment, requires digital measurement for safety interlock systems that automatically shut down machines operating outside safe parameter envelopes.

Predictive maintenance from trend analysis: Historical sensor data logged over time allows detection of gradual parameter drift that indicates developing mechanical problems before they reach failure. A hydraulic pump showing a slowly declining flow rate relative to its pressure output is a pump whose internal efficiency is degrading. Trending that decline across weeks of logged data provides a maintenance prediction that mechanical gauges, with no logging capability, cannot generate.

Calibration traceability: Digital sensors with electronic calibration records support calibration traceability requirements in regulated industries, including food processing vehicles, pharmaceutical manufacturing equipment, and pressure vessels in regulated process industries. Mechanical gauge calibration requires manual test bench procedures at scheduled intervals. Electronic sensor calibration can be verified through in-situ reference measurements logged in the sensor’s calibration record.

Indication Instruments offers a range of digital display and gauge solutions designed for the integration demands of modern heavy machinery applications.

Cost and Lifecycle Considerations

The initial cost comparison between mechanical and digital gauges typically favors mechanical units for simple, standalone applications. A quality Bourdon tube pressure gauge in the 0 to 400 bar range costs significantly less than a comparable piezoresistive pressure transducer plus display module combination.

Total lifecycle cost, however, shifts this comparison meaningfully for applications with more than a few measurement points, any telematics requirement, or precision accuracy needs.

Calibration costs: A mechanical gauge in a vibrating heavy machinery environment typically requires annual calibration to maintain its accuracy specification. A quality digital pressure sensor may require calibration every 2 to 5 years. For a machinery installation with 15 to 20 gauges, the calibration cost differential over a 10-year service life is substantial.

Failure replacement costs: Mechanical gauge failures in heavy machinery are more frequent than digital sensor failures on a per-unit basis, particularly for gauges exposed to vibration and temperature cycling. The labor cost of replacing a physically inaccessible mechanical gauge in a complex machine, plus the parts cost, typically exceeds the cost differential between digital and mechanical units within the first replacement cycle.

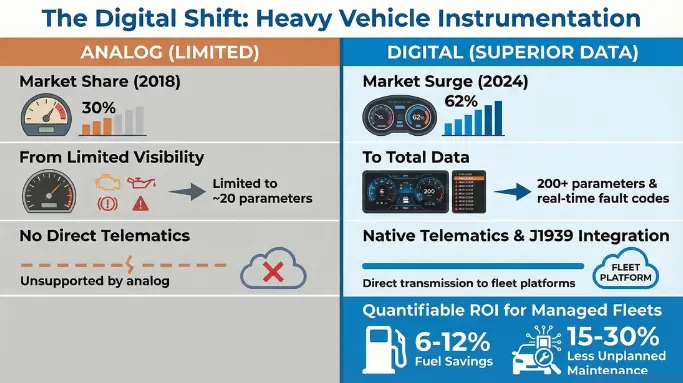
Data infrastructure value: The telematics infrastructure that digital sensors enable reduces unplanned maintenance costs by 15 to 30 percent across well-managed fleet programs, according to McKinsey benchmarks. This benefit does not exist for mechanical gauge installations. It represents a structural cost advantage for digital instrumentation that grows with fleet size and operational complexity.

To discuss digital gauge and display solutions for your heavy machinery application, contact the Indication Instruments team for an application-specific product recommendation.

Frequently Asked Questions

Q1: Can mechanical gauges be replaced with digital equivalents without rewiring the entire machine?

In most cases, yes with some qualifications. A digital pressure transducer installs in the same threaded port as a mechanical Bourdon tube gauge. The transducer output (typically 4 to 20mA or 0.5 to 4.5V) connects to a display module via a two or three wire cable. For applications replacing multiple gauges with a single multifunction digital display, the wiring simplification is significant compared to individual sensor-to-gauge wiring runs.

Q2: What accuracy standard applies to industrial pressure gauges and how do digital transducers compare?

EN 837 and ASME B40.100 are the primary accuracy standards for mechanical Bourdon tube pressure gauges. Class 1 gauges (the most common industrial grade) are specified at plus or minus 1 percent of full scale accuracy when new. In service, accuracy degrades with time and vibration exposure. Industrial digital pressure transducers are typically specified at plus or minus 0.25 to 0.5 percent of full scale with stability specifications that are significantly better than mechanical alternatives over the same service period.

Q3: Are digital sensors more susceptible to electromagnetic interference than mechanical gauges?

Digital sensors with proper EMC design including filtered signal conditioning, shielded cables, and regulated power supply are highly resistant to electromagnetic interference in typical heavy machinery environments. Unshielded long cable runs from sensors to display modules can pick up interference from large motors and switching power supplies if not properly installed. Mechanical gauges are immune to electromagnetic interference but have no output capability, so the comparison is relevant only for applications where signal quality matters.

Q4: What is the typical accuracy drift rate for a mechanical pressure gauge in a vibrating environment?

ISO 5171 includes provisions for gauges in pulsating or vibration environments, recognizing that these conditions accelerate accuracy degradation. Field studies of mechanical gauges in construction and mining equipment environments typically show accuracy drift of 2 to 5 percent of full scale per year in continuously vibrating applications, with some units exceeding 8 percent drift in the most demanding conditions.

Q5: How do digital gauges handle power loss? Do they retain their last reading?

Behavior on power loss depends on the specific display implementation. Most instrument clusters display a defined power-off state when supply voltage is removed. They do not retain the last measurement value in the live display after power loss, which distinguishes them from a mechanical gauge that holds its last reading mechanically until pressure is released. For applications where post-power-loss state indication is operationally important, this behavior needs to be considered in the system design.

Q6: Where can I source digital gauge and display solutions for heavy machinery applications?

Indication Instruments offers a comprehensive range of digital display and instrumentation solutions for heavy machinery applications, covering pressure, temperature, speed, and multi-parameter monitoring requirements. Products are available for both new-build and retrofit programs with engineering support for integration specification.

Analog vs Digital Instrument Clusters for Heavy Vehicles: A Practical Guide

Analog vs Digital Instrument Clusters for Heavy Vehicles: A Practical Guide

Analog vs Digital Instrument Clusters for Heavy Vehicles: A Practical Guide

Introduction: An Honest Answer to a Question I Get Asked Regularly

Fleet managers, equipment operators, and procurement teams ask me regularly whether replacing analog instrument clusters with digital units is worth the investment for heavy vehicles. My answer has become more nuanced over the years because the right answer genuinely depends on the application, the fleet size, the operational model, and the existing telematics infrastructure.

What I will not do is give a reflexive answer in either direction. The digital transition in heavy vehicle instrumentation is real, it is accelerating, and in most professional fleet and construction applications the case for digital is strong and quantifiable. But I have also seen programs that specified digital clusters for simple, low-duty-cycle equipment where the additional cost delivered no meaningful operational benefit. Technology selection should follow operational requirements, not vendor enthusiasm.

This post presents an honest assessment of what analog clusters do well, where they fall short in modern fleet operations, what digital clusters add and at what cost, and how to structure the migration decision for existing fleet programs.

The global heavy vehicle instrumentation market is expected to reach USD 8.1 billion by 2027, according to Fortune Business Insights. Within that figure, the share represented by digital display technology has grown from approximately 30 percent in 2018 to an estimated 62 percent in 2024, with continued acceleration expected as telematics integration requirements become standard in commercial fleet procurement.

What Analog Clusters Actually Do Well

I want to start here because the analog cluster’s strengths are real and underappreciated in a market that has a strong commercial incentive to promote digital alternatives.

Mechanical simplicity: A traditional analog cluster has a limited number of components that can fail. The gauge movements are electromechanical. The warning lights are direct-wired. There is no firmware, no software update requirement, and no display processor that can malfunction or require rebooting. For operators who value repairability in remote locations without specialized tooling, this simplicity has genuine operational value.

Instant operator familiarity: Experienced operators who have spent decades reading analog gauges read them accurately and efficiently without conscious effort. The relative position of a needle on a graduated arc is processed peripherally, without the focused attention that reading a numerical value from a digital display requires. For short-duration, frequent-glance parameters like engine speed and road speed, an experienced operator may actually extract information faster from an analog gauge than from a digital readout.

Resilience to software failures: Digital cluster platforms depend on software that can have bugs, require updates, and occasionally fail in ways that produce incorrect displayed values without any hardware fault. An analog gauge that is mechanically and electrically functional will display the correct value. A digital display showing a software-generated incorrect value provides no visible indication that the displayed data is wrong. For safety-critical parameters, this distinction has operational significance.

Lower initial cost in simple applications: For equipment where only 8 to 12 parameters need to be displayed, where telematics integration is not required, and where the operating environment does not stress display electronics, an analog cluster can be a cost-appropriate choice that delivers adequate operational capability without the overhead of a digital platform.

Where Analog Clusters Fall Short in Modern Operations

The strengths of analog clusters are real but bounded. In modern professional fleet and construction operations, several gaps make them increasingly inadequate.

Limited parameter capacity: A typical analog cluster can display 12 to 20 parameters. A modern commercial truck engine ECU monitors more than 200 parameters. Everything the ECU knows about the vehicle’s operational state that the cluster cannot display is invisible to the driver. Fault conditions that do not trigger one of the handful of hard-wired warning lights go unnoticed until they escalate to a major failure.

No fault code display: When a J1939 fault code is generated, an analog cluster’s only response is a generic warning light. The driver knows something is wrong but has no information about what. A digital cluster displays the fault description, severity level, and recommended action. The difference in the driver’s ability to respond appropriately is significant.

No telematics integration: Fleet management platforms need real time data from every vehicle in the fleet. An analog cluster cannot transmit vehicle operating data to a telematics platform. Fleet operators using analog clusters are dependent on manual driver reporting or OBD-II dongle-based aftermarket telematics devices, which provide limited parameter sets and no display feedback to the driver.

Inflexibility as vehicle systems evolve: When an OEM updates the engine management system or adds new emissions monitoring requirements, a digital cluster’s firmware can be updated to display the new parameters. An analog cluster’s fixed gauge set cannot adapt. Fleet operators using analog clusters on older vehicles find themselves with an increasing number of vehicle systems that generate data no one in the cab can see.

What Digital Clusters Add: A Direct Comparison

The table below provides a direct operational comparison between analog and digital instrument cluster implementations in heavy vehicle applications, across the criteria that most directly affect fleet operations.

CriterionAnalog ClusterDigital ClusterBest Suited For
Parameter Capacity12 to 20 fixed parameters60 to 200+ configurable parametersDigital for complex vehicles
Fault Code DisplayGeneric warning light onlyReal time DTC with text descriptionDigital for all fleet applications
Telematics IntegrationNot supported nativelyDirect J1939 TCU integrationDigital for managed fleets
Driver Performance FeedbackNoneLive coaching display and scoresDigital for safety-focused fleets
ADAS Alert RenderingNot supportedFull alert overlay capabilityDigital for modern vehicle platforms
Display ConfigurabilityNone: fixed gauge layoutOperator-configurable zones and parametersDigital for multi-role equipment
OTA ConfigurationNot applicableRemote display configuration updateDigital for large fleets
Software Failure RiskNone (hardware only)Firmware bugs possible, requires managementAnalog for simplest applications
Maintenance and RepairSimple, field-repairableRequires trained technician or unit replacementAnalog for very remote operations
Initial CostLower for basic requirementsHigher initial cost, lower TCO at scaleAnalog for budget-constrained simple programs
Electrification CompatibilityVery limitedFull EV and hybrid parameter supportDigital for electrified fleets

The Migration Case: How to Structure the Decision

For fleet operators considering the migration from analog to digital clusters on an existing fleet, the decision framework I use starts with three questions.

What parameters are you currently not seeing? Audit the gap between what your vehicle ECUs monitor and what your analog clusters display. If that gap contains parameters that would materially affect driver decisions, maintenance scheduling, or fleet compliance, the case for digital is strengthened directly.

What does fleet management platform integration cost you without digital clusters? Calculate the manual data entry effort, aftermarket OBD-II dongle costs, and management overhead associated with operating a fleet without real time telematics integration. The operational cost of the analog baseline is often the most compelling element of the digital ROI calculation.

What is the service life of the vehicles in question? If the vehicles are within three years of scheduled replacement, the investment in digital cluster retrofitting may not recover within the remaining service life. In that case, specifying digital clusters on the replacement vehicles is the cleaner approach. For vehicles with 8 to 15 years of remaining service life, the upgrade economics typically favor retrofit.

Retrofit options range from aftermarket plug-in OBD-II display modules for light applications to full cluster replacement programs with J1939-integrated digital display units. The right scope depends on the vehicle’s network architecture and what level of integration the fleet management platform requires.

For retrofit and new-vehicle digital cluster options for heavy vehicle applications, the product range at Indication Instruments covers a spectrum of capability levels matched to different operational and budget requirements.

When Analog Still Makes Sense

I do not believe every heavy vehicle application should move to digital instrumentation. There are contexts where analog remains appropriate.

Very simple equipment with a small parameter set and no telematics requirement, such as a single-function industrial pump unit or a low-duty-cycle static generator set, does not benefit materially from a digital cluster. The additional cost buys no operational value in these applications.

Environments where display electronics face extreme levels of electromagnetic interference, such as certain high-power welding or induction heating applications, may favor the electromagnetic robustness of simple analog gauge circuits over digital display electronics, though proper EMC design in industrial digital displays addresses most of these concerns in practice.

Legacy vehicle platforms with non-standard sensor outputs that are not CAN-based may require analog displays as the path of least resistance, unless a signal conditioning interface is installed to convert legacy sensor signals to CAN bus messages.

If you are assessing whether digital or analog is the right choice for a specific application, the team at Indication Instruments can provide an objective application assessment.

Frequently Asked Questions


Q1: Can digital instrument clusters replace analog ones without changing the vehicle’s existing wiring?

In most cases, yes with qualifications. If the vehicle has a CAN bus network, a CAN-connected digital display can read vehicle data without replicating the individual sensor wiring of the analog cluster. However, the physical mounting dimensions, connector footprints, and power supply requirements need to be confirmed for each specific vehicle and cluster combination. A direct drop-in replacement is possible in some applications but should not be assumed without verification.

Q2: Are there heavy vehicle applications where analog clusters are still specified as new equipment?

Yes. Some specialized industrial vehicles and construction machines continue to use analog instrumentation where the application is simple, the service environment is extreme in ways that challenge digital electronics, and the operator base has strong familiarity with analog gauge interfaces. These cases are becoming less common as digital platform robustness improves and the telematics integration value proposition becomes more compelling across all commercial vehicle segments.

Q3: How long does it take to train operators on a digital cluster interface after migration from analog?

In a well-designed digital cluster with a clear, logical interface, operators familiar with the equivalent analog cluster typically reach comfortable operation within one to two shifts. The transition is most straightforward when the digital cluster’s default parameter display closely mirrors the layout and parameter set of the analog unit it replaces. Operators who struggle most are those who were expert at reading the subtle nuances of an analog gauge movement and find the transition to discrete digital readout counterintuitive.

Q4: What is the typical ROI timeline for a fleet-wide digital cluster upgrade program?

For large managed fleets, the ROI is typically driven by three factors: fuel savings from real time driver coaching (6 to 12 percent, recovering within 12 to 18 months at typical fleet fuel costs), maintenance cost reduction from earlier fault detection (15 to 30 percent reduction in unplanned maintenance, recovering within 18 to 24 months), and reduced fleet management labor through automated telematics reporting. Combined, these typically produce an ROI within 2 to 3 years for fleets of 50 or more vehicles.

Q5: Do digital clusters require more maintenance than analog ones?

Digital clusters require less mechanical maintenance than analog gauge movements, which have wear components including the needle bearings and stepper motors in electrical analog gauges. Digital clusters require firmware update management, which is a software maintenance task with no equivalent in analog systems. The total maintenance burden is generally lower for digital units in normal operating conditions, but the failure mode, a display electronics fault versus a gauge movement fault, requires different diagnostic skills.

Q6: Where can I compare analog and digital cluster options for my heavy vehicle application?

Indication Instruments offers both traditional and digital instrumentation solutions across a range of heavy vehicle applications. The team can help assess which approach best matches your specific operational requirements and budget.

Related Articles

  1. Digital Gauges vs Mechanical Gauges in Heavy Machinery: A Technical Comparison
  2. Advanced Digital Instrument Clusters for Heavy Duty Trucks and Industrial Vehicles
  3. How Modern Instrument Clusters Improve Driver Awareness and Vehicle Diagnostics
  4. CAN Bus Integration in Digital Displays: How It Improves Vehicle Performance
  5. Rugged Instrument Clusters for Off-Highway Vehicles: Features and Benefits
CAN Bus Integration in Digital Displays: How It Improves Vehicle Performance

CAN Bus Integration in Digital Displays: How It Improves Vehicle Performance

CAN Bus Integration in Digital Displays: How It Improves Vehicle Performance

Introduction: CAN Bus Is Not Plug and Play

One of the most persistent misunderstandings I encounter among engineers new to vehicle display integration is the assumption that CAN bus connectivity is straightforward. The protocol is mature, well-documented, and widely supported. The hardware is standardized. Surely connecting a display to a vehicle CAN network is a solved problem.

It is not. The protocol architecture is understood. But getting a digital display to reliably read, interpret, and render vehicle data from a CAN network in a real operating environment involves decisions that significantly affect both the accuracy of the displayed information and the stability of the vehicle’s network behavior. Done well, CAN bus integration transforms what a digital display can do for vehicle performance, driver awareness, and fleet operations. Done poorly, it causes display inaccuracies, network disruption, and integration failures that are difficult to diagnose.

The global automotive CAN bus market is projected to reach USD 3.8 billion by 2026, according to MarketsandMarkets, reflecting the continued dominance of CAN as the primary in-vehicle communication standard across passenger, commercial, and industrial vehicle categories. Understanding what quality CAN bus integration looks like, and what it delivers for vehicle performance and operational visibility, is relevant to anyone specifying display systems for connected vehicle applications.

This post covers the fundamentals of CAN bus architecture as they relate to display integration, the specific performance benefits that CAN-based displays deliver over analog-sensor-wired alternatives, the common integration challenges, and how CAN fits into the broader picture of modern vehicle network architecture.

CAN Bus Fundamentals for Display Integration

CAN (Controller Area Network) was developed by Bosch in the early 1980s and standardized as ISO 11898. Its design was motivated by a need to reduce wiring complexity in vehicles while providing reliable, fault-tolerant communication between distributed electronic control units. Both goals remain as relevant today as they were forty years ago.

Message-based architecture: CAN is not a point-to-point communication system. Every node on the bus can hear every message broadcast by every other node. Each message has an identifier that defines both the message content and its arbitration priority. High-priority messages (with lower identifier values) win arbitration over lower-priority messages when two nodes attempt to transmit simultaneously. This deterministic arbitration behavior makes CAN predictable and real time capable in a way that many later network technologies have struggled to replicate at comparable cost.

High-speed and low-speed networks: CAN operates at data rates up to 1 Mbit/s (high-speed CAN per ISO 11898-2) for powertrain and chassis systems. A fault-tolerant low-speed variant (ISO 11898-3) operates at up to 125 Kbit/s and is used for body electronics where the physical fault tolerance justifies lower performance. Most vehicles run both, connected through gateway ECUs that translate messages between network segments as required.

CAN FD: Controller Area Network with Flexible Data rate is the evolution standard that increases payload size from 8 bytes to 64 bytes and raises maximum data rate to 5 Mbit/s for the data phase. CAN FD is increasingly appearing in premium passenger vehicles and new commercial vehicle platforms where larger payload requirements from ADAS and OTA update use cases exceed the original CAN frame limits. Display hardware specified for new vehicle programs should confirm CAN FD compatibility if the vehicle platform has adopted it.

How CAN Integration Gets Vehicle Data to the Display

A digital display connected to the CAN bus reads message frames from the bus, maps each frame’s identifier to a known parameter definition (typically a J1939 PGN or OEM-specific identifier), extracts the parameter value from the frame’s data payload per the applicable encoding specification, applies scaling and offset factors to convert the raw value to engineering units, and passes the result to the display rendering engine.

This process happens for every parameter displayed, at the update rate at which each parameter is published on the bus. A display showing 80 parameters simultaneously is parsing and rendering 80 separate CAN data streams. The processing architecture of the display’s system on chip determines whether it can handle that workload without latency or dropped updates.

PGN mapping and configuration: In J1939 applications, each parameter group has a standardized PGN that the display must be configured to recognize. Most industrial display platforms include a default J1939 PGN library. However, OEM-specific proprietary PGNs that carry vehicle-specific parameters not covered by the standard specification require custom configuration. Confirming that the display platform supports custom PGN configuration, not just the standard library, is an important specification check.

Display update rate alignment: Each CAN parameter has an appropriate display refresh rate aligned to its physical behavior. Speed should update at 20ms intervals for smooth analogue-style needle movement. Coolant temperature at 200ms is entirely adequate given the thermal time constants of the system. Aligning display refresh rates to CAN message rates avoids unnecessary processing overhead and prevents visible stepping in continuously varying parameters.

Performance Benefits of CAN-Based Display Integration

The shift from direct-wired analog sensors to CAN-based display integration delivers measurable performance improvements across several dimensions.

Performance DimensionAnalog Sensor WiringCAN Bus IntegrationImprovement
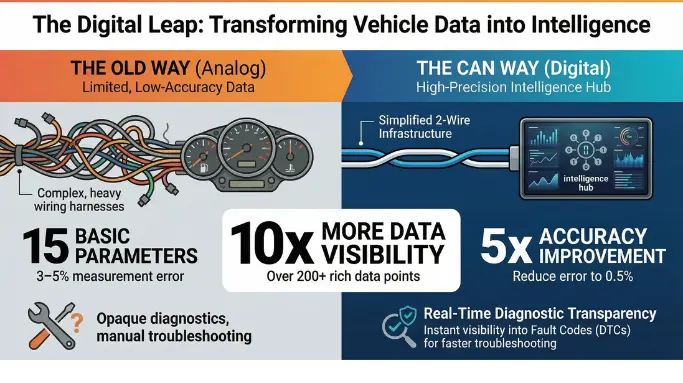
Parameter Count15 to 25 (wire-limited)60 to 200+ parametersUp to 10x more data visible
Measurement AccuracyPlus or minus 3 to 5% typicalPlus or minus 0.5 to 1% (ECU processed)3 to 5x accuracy improvement
Wiring Harness ComplexityIndividual wire per sensor2 wire differential bus, all parametersMajor wiring reduction
Fault Code VisibilityNo fault code display possibleReal time DTC display from J1939Full diagnostic transparency
Sensor Failure DetectionVoltage out of range onlyCAN timeout and message error flagsMore precise fault isolation
OTA ConfigurationNot applicableParameter configuration via CAN messageRemote display configuration possible
Fleet Telematics IntegrationNot supported nativelyDirect TCU integration via shared busFleet visibility enabled
Display Installation EffortHigh: multi-wire harness routingLow: 2 bus wires plus power and groundSignificant installation cost saving
Bus Load ContributionNone1 to 5% typical for display nodeNegligible network impact


Common Integration Challenges and How to Address Them

CAN bus integration in digital displays is a solved engineering problem when approached with the right preparation. The challenges that cause the most field problems are consistently the same ones, and they are consistently avoidable.

Bus termination errors: CAN bus requires a 120-ohm resistive termination at each end of the bus cable. Missing or incorrect termination causes signal reflections that corrupt message frames at high bus utilization. A simple termination resistance check with a multimeter across the bus differential pair (target: 60 ohms for a correctly terminated bus) catches termination errors before they cause field failures.

Message ID conflicts: When a display node is added to an existing CAN network, its messages must not use identifiers already assigned to existing nodes. In J1939 networks, address claiming procedures manage this. In proprietary CAN networks, a bus traffic capture using a CAN analyzer tool before integration reveals the existing ID assignments. Installing a display that conflicts with existing ECU IDs can cause intermittent network errors that are difficult to trace.

CAN bus load management: A display that requests parameter data by transmitting request frames adds to the bus traffic load. A CAN bus running above 70 percent utilization begins to experience message arbitration delays that cause late or missing updates. Specifying a display that listens to broadcast data rather than generating requests, and confirming bus utilization at peak load with a CAN analyzer, prevents load-related display latency in dense ECU environments.

Ground potential differences: CAN differential signaling is robust to common-mode noise, but large ground potential differences between the display and other CAN nodes can push the bus signals outside the receiver’s common-mode input range. Single-point grounding of all CAN bus nodes to a common chassis ground reference eliminates the most common source of this problem in vehicle installations.

For programs where CAN integration reliability is a primary concern, the engineering support team at Indication Instruments has the field integration experience to help identify and resolve common challenges before they reach the production stage.

CAN in the Modern Vehicle Network Architecture

CAN remains the dominant in-vehicle network protocol and will remain so across the majority of commercial and industrial vehicle categories for the foreseeable future. Its combination of robustness, determinism, low cost, and universal ECU support make it difficult to displace in applications that do not require the bandwidth of Automotive Ethernet.

Automotive Ethernet (100BASE-T1 and 1000BASE-T1) is increasingly used in high-bandwidth applications: camera feeds for ADAS, large OTA update file transfers, and high-resolution display video streams. These are the specific use cases where CAN’s bandwidth ceiling becomes a constraint. In the foreseeable future, most commercial and industrial vehicle networks will be hybrid architectures: Automotive Ethernet for high-bandwidth subsystems, CAN for the real time control and sensor communication where its determinism and robustness are most valuable.

Digital displays in these hybrid architectures will need to handle both protocol types. Evaluating candidate display platforms for multi-protocol capability, specifically the ability to parse CAN parameters and render Ethernet-sourced video or data simultaneously, is relevant for vehicle programs targeting 2025 and beyond.

Explore CAN-ready digital display solutions at Indication Instruments for a range of options suited to commercial and industrial vehicle CAN integration requirements.

Frequently Asked Questions


Q1: What is the maximum number of nodes that can be connected to a single CAN bus?

ISO 11898 specifies a theoretical maximum of 32 nodes on a single CAN network segment at full 1 Mbit/s speed. In practice, bus termination and cable impedance characteristics affect the practical maximum. Networks with more nodes are typically segmented using gateway ECUs that bridge between bus segments. A digital display connected as a passive listener (reading broadcast messages without generating requests) contributes minimal load and does not meaningfully constrain the node count on most commercial vehicle networks.

Q2: What is the difference between J1939 PGN configuration and OBD-II PID support?

J1939 PGNs define structured data messages carrying multiple parameters per frame, with standardized message identifiers and data encoding defined by the SAE J1939 specification. OBD-II PIDs are single-parameter diagnostic queries sent to the vehicle’s diagnostic connector and responded to by the relevant ECU. J1939 is the native bus protocol for commercial vehicles. OBD-II is a diagnostic access layer typically used by external devices connecting to the vehicle via the diagnostic port.

Q3: Can a display connected to the CAN bus affect vehicle network performance?

A passively listening display node contributes no transmit load to the bus. A display that actively transmits, for example sending request frames for specific parameters, contributes to bus load. A well-designed display in a J1939 application subscribes to broadcast data rather than generating individual parameter requests, keeping its bus load contribution below 2 percent in typical commercial vehicle networks.

Q4: How does CAN bus integration compare to Modbus for industrial equipment applications?

CAN is the preferred protocol for vehicular applications because of its multi-master broadcast architecture, deterministic message prioritization, and automotive-grade component ecosystem. Modbus is a widely used industrial protocol for stationary machinery and process equipment, operating on RS-485 physical layers. For off-highway vehicles, J1939 over CAN is the appropriate standard. Modbus may appear in some specialized industrial attachments or older telematics equipment but is not a native vehicle communication protocol.

Q5: What tools do I need to validate CAN bus integration for a digital display?

A CAN bus analyzer tool, such as the Peak PCAN-USB or Vector CANalyzer, is essential for capturing and analyzing bus traffic before and after display integration. It allows verification of message ID assignments, bus load measurement, and monitoring of message timing and error rates. For J1939 applications, a J1939-aware analysis tool that decodes PGNs is significantly more useful than a raw frame analyzer.

Q6: Where can I find digital displays with robust CAN bus integration for vehicle applications?

Indication Instruments offers a range of digital display and instrumentation solutions with verified CAN bus integration capability for J1939, CANopen, and OBD-II applications. The team can support both specification and integration validation.

Related Articles

  1. The Importance of Sensor Integration in Modern Vehicle Instrument Clusters
  2. The Role of Instrument Clusters in Connected Vehicle Ecosystems and Telematics Integration
  3. SAE J1939 Protocol Guide: What Fleet Engineers Need to Know
  4. Advanced Digital Instrument Clusters for Heavy Duty Trucks and Industrial Vehicles
  5. How Modern Instrument Clusters Improve Driver Awareness and Vehicle Diagnostics