The Importance of Sensor Integration in Modern Vehicle Instrument Clusters

Introduction: Four Sensors Every Cluster Must Get Right
I want to start with something that happened on a test drive a few years back. We were validating a new instrument cluster integration on a commercial truck platform and everything looked fine in the workshop. All parameters reading correctly, CAN traffic healthy, no DTCs. We pulled the truck out onto a test road, ran it through its warm-up cycle, and the fuel level gauge read 78 percent full when the tank was actually at 91 percent. Nobody had caught it during bench testing because the fuel level sender only starts behaving differently once the truck is moving and the fuel is sloshing.
That experience reinforced something I now repeat to every engineer joining our team: sensor integration is not finished when the display shows a number. It is finished when the display shows the right number, at the right time, under the actual operating conditions of the vehicle. That distinction matters enormously in field applications.
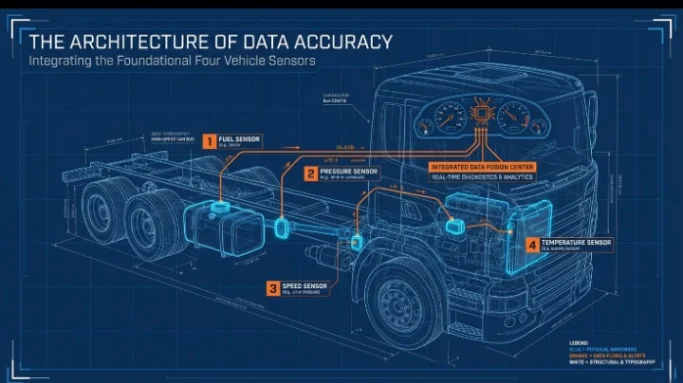
The global vehicle sensor market is projected to reach USD 47.2 billion by 2027, according to Allied Market Research, driven by ADAS proliferation, electrification, and connected vehicle telematics requirements. Modern instrument clusters sit at the convergence point of all this sensor data. Among the many sensor types that feed into a cluster, four are foundational to commercial and industrial vehicle operation: fuel level sensors, pressure sensors, speed sensors, and temperature sensors.
This post goes deep on each of those four, covering the sensor technology, the integration architecture, the calibration requirements, and the display accuracy considerations that determine whether the cluster is genuinely useful or just superficially impressive.
Fuel Level Sensors: More Complex Than a Float on a Wire
Fuel level measurement sounds like one of the simpler problems in vehicle instrumentation. You have a tank. You want to know how full it is. In practice, it is one of the most consistently problematic sensor integrations I have encountered across dozens of vehicle programs.
How Fuel Level Sensors Work
The majority of commercial vehicles still use resistive float sender units as their primary fuel level measurement technology. A float arm pivots as the fuel level changes, moving a wiper across a resistive track. The resistance value, typically ranging from 10 ohms full to 180 ohms empty in common sender configurations, is read by the ECU and converted to a percentage or volumetric reading.
More sophisticated applications use capacitive or ultrasonic level sensors. Capacitive sensors measure the dielectric change between two electrodes submerged in the fuel tank, which varies with fuel level. They are less susceptible to fuel sloshing and mechanical wear, and they work correctly in non-standard tank geometries where a float arm would bind or give a non-linear reading. Ultrasonic sensors measure the time of flight of an ultrasonic pulse from the sensor head to the fuel surface and back, giving a level reading independent of the fuel’s electrical properties.
Integration and Display Accuracy Challenges
The non-linearity problem is the most common source of fuel level display errors. Most fuel tanks are not cylindrical. They are shaped around chassis, suspension, and body constraints. A tank that is 75 percent full by volume may only be 60 percent full by depth, because the tank cross-section changes with height. Accurate fuel level display requires a tank-specific calibration lookup table in the ECU that maps sender resistance to actual volume. Generic, uncalibrated integrations routinely show errors of 10 to 15 percent at mid-tank levels.
Fuel sloshing during acceleration, braking, and cornering creates transient sensor readings that, if displayed directly, produce a gauge that visibly oscillates during normal driving. Proper integration applies a damping algorithm, typically a rolling average or a low-pass filter with a time constant matched to the vehicle’s operational dynamics, before the value reaches the display. The filter needs to be tuned specifically for the vehicle type: a long-haul truck on motorway grades needs different damping than a short-wheelbase agricultural vehicle on hilly terrain.
Indication Instruments’ fuel level display solutions: View panel meters and display products that support configurable calibration tables for non-linear tank geometries and adjustable signal damping parameters for accurate fuel level display across vehicle types.
Pressure Sensors: Safety-Critical Measurement from Oil to Hydraulics
Pressure is one of the most safety-critical parameters in commercial and industrial vehicles. Engine oil pressure, hydraulic system pressure, transmission oil pressure, air brake reservoir pressure, fuel rail pressure, and coolant pressure are all monitored by sensors whose readings directly influence safety-critical decisions, whether automated by the vehicle’s control systems or made by the operator based on what they see on the cluster display.
Sensor Technology: Piezoresistive Transducers
The dominant technology for vehicle pressure measurement is the piezoresistive pressure transducer. A silicon or metal diaphragm deflects under applied pressure, and the strain changes the resistance of piezoresistive elements diffused into or bonded to the diaphragm surface. The resistance change produces a millivolt output that is amplified and conditioned to a standard signal range, typically 0.5 to 4.5 volts for ratiometric sensors, or converted to a 4 to 20 milliamp current loop output for industrial applications.
Modern pressure sensors integrate signal conditioning, temperature compensation, and analog-to-digital conversion on-chip, outputting a digital value directly via I2C, SPI, or CAN. For heavy vehicle applications, sensors with integrated CAN output publish pressure data directly onto the vehicle bus, eliminating the separate signal conditioning chain and reducing integration complexity.
Absolute, Gauge, and Differential Pressure
These distinctions matter for integration and display accuracy. Absolute pressure sensors reference to a perfect vacuum. Gauge pressure sensors reference to ambient atmospheric pressure and are the standard for most vehicle fluid pressure measurements, since the operator needs to know pressure above or below atmospheric, not above vacuum. Differential pressure sensors measure the pressure difference between two points, relevant for applications like air filter restriction monitoring where the pressure drop across the filter indicates contamination level.
Specifying the wrong pressure reference in a sensor integration is a surprisingly common error. An absolute pressure sensor in an oil pressure monitoring application will show a reading approximately 1 bar higher than the actual gauge pressure at sea level, and that offset shifts with altitude for high-elevation operation. For a sensor with a full-scale range of 0 to 10 bar, a 1 bar offset from incorrect sensor type selection is a 10 percent constant error across the operating range.
Display Accuracy and Warning Threshold Calibration
Pressure warning thresholds in commercial vehicles are often defined by regulatory standards or OEM specification. SAE J1939 PGN 65263 (Engine Fluid Level and Pressure) carries engine oil pressure with a resolution of 4 kPa per bit. The instrument cluster must apply the correct scaling factor and offset to convert the raw 8-bit or 16-bit CAN value to a displayed engineering unit. An incorrect scaling factor in the display configuration produces a systematic display error across the full pressure range, which may not be obvious during commissioning if the displayed value looks plausible.
For hydraulic pressure monitoring in industrial and off-highway vehicles, see the range of panel meters at Indication Instruments engineered for the accuracy and update rate requirements of safety-critical pressure display applications.
Speed Sensors: Tachometers, Speedometers, and What Lies Between
Speed sensing in modern commercial and industrial vehicles covers multiple distinct measurements: vehicle road speed, engine RPM, transmission output shaft speed, wheel speed at individual corners for ABS and stability control, and PTO shaft speed for powered implements. Each has its own sensor technology, update rate requirement, and display accuracy specification.
Hall Effect and Variable Reluctance Sensors
The two dominant technologies for vehicle speed sensing are Hall effect sensors and variable reluctance (VR) sensors, sometimes called inductive sensors. Both work by detecting the passage of ferromagnetic teeth on a toothed ring or reluctor wheel attached to the rotating shaft.
A variable reluctance sensor generates a sinusoidal AC voltage as each tooth passes, with amplitude proportional to the rate of tooth passage. At low speeds the signal amplitude drops, which creates a minimum speed threshold below which the sensor output becomes unreliable. VR sensors have no active electronics and are inherently robust to temperature and vibration, making them a common choice for transmission speed sensing in heavy vehicles.
Hall effect sensors use a magnetic field and semiconductor switching element to generate a clean digital pulse output regardless of speed. The digital output makes signal conditioning simpler and allows accurate speed measurement all the way down to very low shaft speeds, including standstill detection for some configurations. Modern Hall effect sensors with integrated signal conditioning provide a direct digital pulse train output suitable for direct connection to an ECU’s input capture peripheral or a display’s frequency measurement input.
Pulse Counting, Frequency Conversion, and Display Accuracy
Vehicle speed calculation from a pulse-based sensor involves counting pulses over a defined measurement interval, or measuring the interval between successive pulses, and converting the result to velocity using the known tooth count and wheel circumference or shaft gear ratio. The accuracy of the displayed speed depends on the precision of those constants. A tyre wear-related reduction in rolling radius of 5 percent produces a vehicle speed display error of 5 percent if the wheel circumference constant is not updated.
For speedometer applications in commercial vehicles, European type approval and similar regulatory frameworks specify maximum permissible speed display errors, typically plus 10 percent and minus 0 percent, meaning the displayed speed must never be lower than actual speed by any amount. Instrument cluster display software for speed must implement the correct bounds checking and calibration factor application to remain within regulatory limits.
Engine RPM display from crankshaft position sensor data via J1939 PGN 61444 (Electronic Engine Controller 1) requires a display update rate of at least 100ms to avoid visible stepping on the tachometer at normal engine speed ranges. For tachometers that also need to display peak RPM and over-rev events, the capture rate needs to be fast enough to catch transient peaks that may only persist for one or two engine revolutions.
Indication Instruments offers digital displays and instrument clusters with configurable tachometer and speedometer display parameters suited to the pulse input and CAN data requirements of commercial vehicle speed measurement.
Temperature Sensors: From Coolant to Exhaust, One Sensor Type Does Not Fit All
Temperature is the most ubiquitous measurement in vehicle instrumentation. Coolant temperature, engine oil temperature, transmission oil temperature, exhaust gas temperature, ambient air temperature, turbocharger air charge temperature, fuel temperature, and in electrified vehicles, battery cell temperature and motor winding temperature. Each application has specific temperature range, accuracy, and response time requirements that influence the sensor technology selection and integration approach.
NTC Thermistors: The Workhorse of Vehicle Temperature Sensing
Negative temperature coefficient (NTC) thermistors are the dominant temperature sensor type in most vehicle powertrain and fluid temperature applications. Resistance decreases non-linearly as temperature increases. A typical coolant temperature NTC might have a resistance of 2.5 kilohms at 25 degrees C, dropping to approximately 200 ohms at 100 degrees C. The non-linear resistance-temperature characteristic means the ECU must apply a Steinhart-Hart equation or a lookup table to convert the measured resistance to a temperature value.
The advantage of NTC thermistors is low cost, small package size, fast thermal response due to small thermal mass, and robust performance across the temperature ranges typical of coolant and oil temperature applications. The disadvantage is that each sensor type has a unique characteristic curve, so the ECU calibration must be matched to the specific sensor part number. Substituting a sensor from a different manufacturer without updating the calibration table produces a display error that may appear small at one operating point and large at another, because the curves diverge non-uniformly.
RTDs and Thermocouples for High-Temperature Applications
For exhaust gas temperature measurement, NTC thermistors are not suitable. Diesel engine exhaust temperatures range from approximately 200 degrees C at idle to 700 degrees C or above under high load, and up to 900 degrees C in some turbocharged applications at the turbine inlet. These temperatures exceed the operating range of standard NTC thermistors.
Type K thermocouples are the standard technology for exhaust gas temperature measurement. A thermocouple generates a millivolt potential proportional to the temperature difference between its measuring junction (in the exhaust flow) and a cold junction reference (at the measurement electronics). Type K thermocouples have a sensitivity of approximately 41 microvolts per degree C and operate up to around 1200 degrees C. The cold junction compensation requirement adds complexity to the signal conditioning design.
Platinum resistance temperature detectors (PT100 and PT1000 RTDs) are used in applications requiring higher accuracy and linear output over a wide temperature range. Transmission oil temperature monitoring, where accurate temperature tracking affects shift scheduling decisions in an automatic transmission control unit, is a common RTD application. PT100 sensors have a resistance of 100 ohms at 0 degrees C and increase linearly at approximately 0.385 ohms per degree C, making them simple to interface and calibrate with high accuracy.
What the Instrument Cluster Needs to Display Correctly
The instrument cluster receives temperature data as corrected engineering unit values via J1939 CAN messages in most modern commercial vehicle architectures. Engine coolant temperature is carried on PGN 65262 with a resolution of 0.03125 degrees C per bit and an offset of minus 273 degrees C, covering a range from cryogenic to high-temperature operation. Transmission oil temperature is on PGN 65272. Exhaust temperature parameters are carried on specific EGT PGNs depending on the exhaust system configuration.
A common display integration error for temperature parameters is applying the wrong offset. J1939 temperature parameters carry a significant negative offset in the raw CAN value to cover sub-zero temperatures. If the display software applies the scaling factor without the offset, displayed temperatures will appear 200 to 273 degrees lower than actual at ambient conditions, producing an obvious error at startup. Less obvious is when the offset is partially applied, producing a systematic error of 20 to 50 degrees that might not be caught if commissioning validation only checks values at operating temperature rather than across the full range from cold start to full operating temperature.
View the full range of temperature display and monitoring products at Indication Instruments engineered for the accuracy and operating range requirements of commercial and industrial vehicle temperature measurement applications.
Sensor Integration Specifications: A Comparison of All Four Types
The table below summarizes the key integration specifications for fuel level, pressure, speed, and temperature sensors in commercial vehicle instrument cluster applications.
| Specification | Fuel Level | Pressure | Speed | Temperature |
|---|---|---|---|---|
| Primary Sensor Technology | Resistive float sender or capacitive | Piezoresistive transducer | Hall effect or VR pulse sensor | NTC thermistor, RTD, thermocouple |
| Signal Type | Analog resistance or CAN | Analog voltage (0.5 to 4.5 V), 4 to 20 mA, or CAN | Frequency pulse train or CAN | Analog resistance or CAN via ECU |
| Typical Update Rate (CAN) | 500ms to 2 seconds | 100 to 200ms | 20 to 100ms | 200 to 500ms |
| Primary J1939 PGN | PGN 65276 (Dash Display) | PGN 65263 (Engine Fluid Level and Pressure) | PGN 61444 (EEC1), PGN 65265 | PGN 65262 (Engine Temp), 65272 (Trans) |
| Key Calibration Requirement | Non-linear tank geometry table and sloshing filter | Correct pressure reference type and scaling factor | Pulse count per revolution and wheel circumference | Sensor-specific Steinhart-Hart curve or lookup table |
| Accuracy Specification | Plus or minus 3 to 5 percent of full scale | Plus or minus 1 to 2 percent of full scale | Plus or minus 1 percent of reading | Plus or minus 1 to 2 degrees C (NTC/RTD) |
| Typical Temperature Range | Minus 40 to plus 85 C | Minus 40 to plus 125 C | Minus 40 to plus 125 C | Minus 40 to plus 150 C (up to 1200 C EGT) |
| Common Display Failure Mode | Slosh oscillation or non-linear error | Wrong reference type or scaling error | Stepping at low speed, peak capture miss | Offset error from incorrect J1939 decoding |
How the CAN Bus Connects All Four Sensor Types to the Cluster
Every one of the four sensor types described above reaches the instrument cluster via the J1939 CAN bus in a modern commercial vehicle architecture. The bus is the integration backbone, and its behavior directly affects the quality of what the display shows.
Each sensor’s data arrives as a structured CAN frame, identified by a parameter group number (PGN), with a data payload encoded per the J1939 SPN specification for that parameter. The instrument cluster’s CAN controller receives the frames, applies the PGN lookup to identify each parameter, decodes the raw value using the specified resolution and offset, and passes the engineering unit value to the display rendering logic.
Bus health directly affects display accuracy. A CAN bus running above 70 percent utilization experiences message arbitration delays that can cause displayed parameter values to lag behind actual sensor readings. For a temperature or pressure display, a few hundred milliseconds of lag is acceptable. For a speed display used for speedometer output or for displaying wheel speed during ABS activation, even 50ms of lag is operationally significant.
Message timeout handling is the specific integration behavior that separates well-designed clusters from problematic ones. When a fuel level sender fails, or a speed sensor ECU drops off the bus, the cluster must detect the timeout, display a defined fault state for the affected parameter, and log a DTC. Continuing to display the last valid value as though the sensor is still functional is a safety issue in pressure and temperature monitoring applications.
The panel meters and digital displays from Indication Instruments are engineered with the CAN protocol depth, PGN configuration flexibility, and message timeout handling that these four critical sensor types require.
Frequently Asked Questions
Q1: Why does a fuel level gauge often read incorrectly at partial tank levels?
Most fuel tanks have a non-cylindrical shape that changes cross-section at different heights, meaning depth and volume are not proportional. Accurate fuel level display requires a tank-specific calibration table that maps float sender resistance to actual tank volume. Generic calibration without a tank-specific table routinely produces errors of 10 to 15 percent at mid-tank levels. Additionally, vehicle motion causes fuel sloshing that creates transient resistance variations, which must be filtered with a damping algorithm tuned to the vehicle’s dynamics.
Q2: What is the difference between gauge pressure and absolute pressure sensors, and why does it matter for display accuracy?
Gauge pressure sensors reference to ambient atmospheric pressure, which is the standard for most vehicle fluid pressure monitoring (oil pressure, hydraulic pressure, air pressure). Absolute pressure sensors reference to a perfect vacuum. Using an absolute pressure sensor where a gauge pressure sensor is specified results in a displayed pressure reading approximately 1 bar higher than actual at sea level, with additional variation at altitude. This is a systematic calibration error that appears reasonable during bench testing but produces incorrect warnings in field operation.
Q3: What causes stepping or jumping behavior on a digital speedometer display?
Speedometer stepping occurs when the speed sensor pulse update rate or the CAN message publication rate is slower than the display refresh rate, causing the displayed value to update in discrete jumps rather than smoothly. At 20 mph with a 12-tooth reluctor wheel, the pulse interval is approximately 28ms. If the display samples the CAN speed message at 100ms intervals and the message is only published at 100ms, there is a visible two-digit jump every update cycle. Solutions include increasing the CAN message publication rate, using pulse-period averaging in the ECU before publishing, or applying display-side smoothing algorithms.
Q4: What temperature sensor type should be specified for exhaust gas temperature monitoring?
Type K thermocouples are the standard for exhaust gas temperature measurement in diesel and gasoline engines, covering the operating range from approximately 0 degrees C to 1200 degrees C. They require cold junction compensation at the measurement electronics and have a non-linear output that needs to be characterized over the operating range. For applications below 500 degrees C where higher accuracy is needed, such as charge air temperature monitoring, PT100 or PT1000 RTDs provide better linearity and repeatability than NTC thermistors.
Q5: How should an instrument cluster handle a situation where a pressure sensor signal is lost?
A correctly implemented cluster monitors the CAN message timeout interval for each pressure parameter. If the oil pressure message from the engine ECU stops arriving within the expected interval, the cluster should immediately transition the oil pressure display to a defined fault state, typically a symbol and ‘Sensor Fault’ message, generate a DTC for the communication fault, and trigger a caution-level alert to the driver. Continuing to display the last valid pressure value after a sensor communication fault is a safety issue, because the driver may be relying on that reading to assess whether to continue operating the vehicle.
Q6: Where can I find display and panel meter solutions suited to fuel level, pressure, speed, and temperature monitoring?
Indication Instruments offers a range of panel meters, digital displays, and instrument cluster solutions engineered for the CAN integration depth, calibration flexibility, and environmental tolerance that commercial vehicle sensor monitoring applications require. The product range covers both J1939 CAN-connected displays and direct analog sensor input meters for the fuel level, pressure, speed, and temperature parameters covered in this post.
Related Articles
- CAN Bus Integration in Digital Displays: How It Improves Vehicle Performance
- How Modern Instrument Clusters Improve Driver Awareness and Vehicle Diagnostics
- The Role of Instrument Clusters in Connected Vehicle Ecosystems and Telematics Integration
- Advanced Digital Instrument Clusters for Heavy Duty Trucks and Industrial Vehicles
- Digital Gauges vs Mechanical Gauges in Heavy Machinery: A Technical Comparison

R&D Manager, Indication Instruments Ltd.
Dr. Manisha Hooda holds a PhD in Power Systems and currently serves as R&D Manager – Automotive Sensors at Indication Instruments Limited. With expertise in market research, product development, cross-functional team leadership, and APQP methodologies, she is passionate about driving innovation and delivering customer-focused engineering solutions.
LinkedIn: Dr. Manisha Hooda