How Modern Instrument Clusters Improve Driver Awareness and Vehicle Diagnostics in Commercial Trucks

Introduction: The Data Was There. The Driver Just Could Not See It
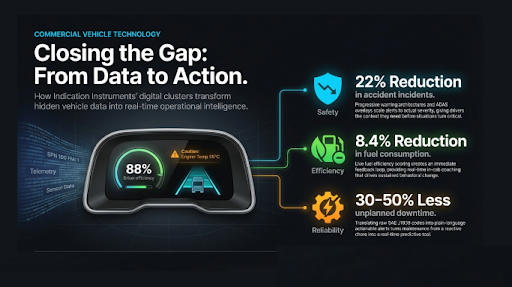
A fleet manager I worked with a few years ago told me something I have thought about repeatedly since. He said his company had reduced road accident incidents by over 22 percent in a single year, not by changing routes, not by hiring different drivers, and not by implementing a new safety program. The only change was replacing the instrument clusters in 200 trucks with connected digital units that displayed real time driver performance data alongside standard vehicle parameters.
Modern instrument clusters close that gap. They take data that previously existed only in post-drive fleet reports and put it in front of the driver in real time, where it can influence behavior while it still matters. That is the core value proposition, and it is more significant than the industry’s tendency to focus on display technology aesthetics suggests.
This post covers how modern digital clusters improve driver awareness through better information architecture, how they transform vehicle diagnostics from a maintenance function to a real time operational capability, and what the measurable outcomes look like at fleet scale.
The Driver Awareness Problem in Commercial Trucks
Traditional instrument clusters in commercial trucks were designed around a principle of minimalism: show only what the driver absolutely needs to monitor, and keep everything else out of sight. The result was a fixed display showing speed, RPM, fuel level, coolant temperature, and a handful of warning lights. Effective for the operational context of earlier vehicle generations, but increasingly inadequate as vehicle systems became more complex and fleet operators began demanding real time operational intelligence.
The problem is not that traditional clusters showed too little information in absolute terms. It is that they showed the wrong information in the wrong priority order, and they showed it in a way that required the driver to interpret analog gauge positions rather than reading direct parameter values. A driver monitoring a coolant temperature needle that is climbing toward the red zone has to make a judgment call about when to act. A driver whose cluster shows 107 degrees C and a caution-level alert with specific guidance has far less ambiguity to resolve.
According to the American Transportation Research Institute, driver-related factors contribute to approximately 88 percent of commercial truck accidents. Not all of those are addressable by better displays, but a meaningful subset involves situations where the driver lacked timely, clear information about vehicle condition or their own driving behavior. Modern cluster design addresses that gap directly.
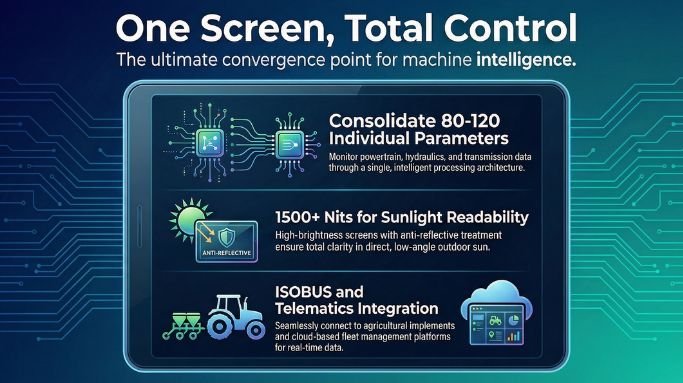
The European Commission’s road safety framework has introduced requirements for intelligent speed assistance, advanced emergency braking, and driver drowsiness detection in commercial vehicles. All of these systems require display output on the instrument cluster. The practical effect is that clusters in modern European commercial vehicles must handle ADAS alert rendering as a core function, not an optional add-on.
Visual Warning Architecture: How Modern Clusters Prioritize Alerts
The most significant improvement in driver awareness capability between traditional and modern clusters is not display resolution. It is alert prioritization architecture.
Warning severity levels: SAE J1939 defines a four-tier fault classification system: advisory, caution, warning, and stop. Modern commercial truck clusters implement this classification visually through a combination of color, position, and attention-capture behavior. Advisory messages appear as informational text with amber indicators. Stop-level alerts, such as critical oil pressure loss or brake system failure, trigger full-screen warnings with audible alerts and specific driver action instructions. This tiered approach means the driver’s attention is scaled to the actual severity of the situation.
Progressive warning systems: For parameters that approach critical thresholds gradually, like engine temperature rising toward overheating, modern clusters implement progressive warning sequences that alert the driver before the situation becomes critical. A caution-level amber alert at 95 degrees C gives the driver time to respond before the stop-level warning triggers at 108 degrees C. The interval between those two states is where driver action prevents a breakdown rather than responds to one.
ADAS overlay integration: Lane departure warnings, forward collision alerts, and blind spot indicators from ADAS sensors are rendered on the instrument cluster alongside standard vehicle parameters. The cluster display logic must prioritize these safety-critical overlays correctly so they appear prominently when triggered without obscuring essential vehicle operating data the driver needs simultaneously.
Getting this warning architecture right is a design discipline, not just a feature list. Poorly designed alert systems that trigger too frequently, display too vaguely, or interrupt normal parameter visibility are actively counterproductive because drivers learn to ignore them. The clusters that genuinely improve safety are the ones whose alert systems are calibrated for signal-to-noise quality, not maximum feature count.
Vehicle Diagnostics: From Maintenance Function to Real-Time Operational Tool
In a traditional fleet maintenance model, vehicle diagnostics are a periodic activity. A truck returns to the depot, a technician plugs a diagnostic tool into the OBD-II port, downloads the fault code log, and schedules maintenance based on what they find. The driver in this model is largely a passive participant in the diagnostic process. They report symptoms when something feels wrong. The systematic data sits in logs they cannot access.
Connected digital instrument clusters change this model fundamentally. The cluster reads diagnostic trouble codes (DTCs) directly from the vehicle’s J1939 network in real time and presents them on screen with three pieces of information the driver actually needs: what the fault is, how severe it is, and what action is required. This converts the diagnostic data stream from a maintenance archive into an operational tool.
DTC display and interpretation: SAE J1939 defines standardized fault code structures with specific suspect parameter numbers (SPNs) and failure mode identifiers (FMIs). Modern clusters translate these machine codes into plain language descriptions on the display. ‘SPN 100 FMI 1’ becomes ‘Engine Oil Pressure Low: Reduce Load.’ The driver receives actionable guidance without requiring diagnostic tool expertise.
Predictive maintenance alerting: Some cluster platforms integrate with backend fleet telematics systems that run predictive maintenance models against historical sensor data. When a model detects an anomalous pattern, such as increasing oil temperature variance over a week of operation, it pushes a predictive alert through the telematics platform to the cluster display before any DTC has been generated. McKinsey research indicates that predictive maintenance programs reduce unplanned downtime by 30 to 50 percent compared to reactive maintenance models.
The instrument cluster range at Indication Instruments is designed around the J1939 protocol depth and display architecture that makes real time diagnostics operationally meaningful for commercial truck applications.
Comparison: Traditional vs. Modern Cluster Capabilities
The table below summarizes the specific improvements in driver awareness and diagnostic capability between traditional and modern instrument cluster implementations in commercial truck applications.
| Capability Area | Traditional Cluster | Modern Digital Cluster |
|---|---|---|
| Vehicle Parameters Displayed | 12 to 20 fixed analog gauges | 60 to 200 configurable digital parameters |
| Alert Presentation | Warning light only, no context | Tiered color alerts with text description and driver action guidance |
| Fault Code Access | Requires workshop diagnostic tool | Real time DTC display on cluster in plain language |
| Driver Performance Feedback | None | Live fuel efficiency score, braking events, speed compliance |
| ADAS Integration | Not supported | Lane departure, collision warning, fatigue alert overlay |
| Predictive Maintenance | Not applicable | Backend model alerts pushed to cluster via telematics |
| Hours of Service Display | Not supported | ELD-integrated driver hours display and compliance alerts |
| Fleet Platform Visibility | Data unavailable to fleet manager in real time | Live parameter data transmitted to fleet management dashboard |
| Remote Diagnostics | Not applicable | Fault codes and health status visible remotely to maintenance team |
| Language and Localization | Fixed single language | Multi-language support with region-specific regulatory alerts |
Driver Coaching: The Real-Time Feedback Loop
One of the most operationally valuable capabilities of modern connected clusters is real time driver coaching, and it is consistently underestimated in procurement conversations that focus on diagnostic features.
When a driver sees their fuel efficiency score update every few minutes on the cluster display, with a clear indication of whether their current driving style is above or below the fleet average, the feedback loop is immediate. They can see the score improve when they ease off the accelerator on a long descent. They can see it drop when they accelerate unnecessarily after a junction. This immediate feedback is more effective at changing behavior than a weekly report reviewed with a manager, for the straightforward reason that the human brain responds better to feedback that is temporally connected to the action that generated it.
According to a 2023 research study published in the Transportation Research Record, real time in-cab driver coaching through instrument cluster displays reduced fuel consumption by an average of 8.4 percent across a 500-vehicle fleet trial over twelve months. The reduction was sustained beyond the initial novelty period, suggesting genuine behavioral change rather than temporary performance.
For fleets exploring the capabilities of connected instrument cluster technology, the panel meter and display product range at Indication Instruments provides a range of solutions suited to both retrofit and new-vehicle programs.
Fleet Management Integration: Closing the Loop
Driver awareness improvements and diagnostic visibility in the cab are valuable on their own. But the full value of modern instrument cluster technology is realized when the cluster’s data feeds into a fleet management platform that gives operations teams the same visibility the driver has, at fleet scale and with longitudinal analytics.
A fleet manager monitoring 200 trucks through a connected dashboard can see, in real time, which vehicles are generating active fault codes, which drivers are showing low fuel efficiency scores, which vehicles are approaching maintenance intervals based on actual parameter readings rather than calendar schedules, and which trucks are approaching their legal driving hours limits. The instrument cluster in each cab is the source node for all of that intelligence.
Speaking with the engineering team at Indication Instruments about specific fleet telematics integration requirements is the most efficient path to matching cluster hardware to fleet platform architecture.
Frequently Asked Questions
Q1: How do modern instrument clusters display diagnostic trouble codes to drivers?
Modern clusters connected to the vehicle’s J1939 network read DTCs in real time and display them as plain language descriptions rather than raw fault codes. A well-designed cluster shows the fault description, the severity level per SAE J1939 classification, and the recommended driver action. This converts diagnostic data from a workshop tool into an operational communication channel between the vehicle and the driver.
Q2: What is the SAE J1939 fault classification system and why does it matter for display design?
SAE J1939 classifies faults across four severity levels: advisory (informational, no immediate action), caution (operator awareness required), warning (action recommended promptly), and stop (immediate safe stop required). A cluster that visually differentiates these levels correctly ensures drivers scale their response to the actual severity rather than treating every alert as equally urgent or equally ignorable.
Q3: Can modern instrument clusters interface with ELD (Electronic Logging Device) systems?
>
Yes. ELD-integrated clusters display driver hours of service status directly on the cluster screen, providing drivers with real time visibility into remaining drive time, required rest periods, and hours of service compliance status. This integration reduces the risk of unintentional hours violations by making compliance information continuously visible rather than requiring the driver to check a separate device.
Q4: What is the measurable fuel economy improvement from real time driver coaching displays?
Research across multiple fleet trials consistently shows fuel economy improvements of 6 to 12 percent when drivers receive real time efficiency feedback through instrument cluster displays. The McKinsey connected vehicle benchmark puts fleet-wide fuel savings from telematics-integrated display coaching at approximately 10 to 15 percent when combined with backend analytics.
Q5: How does predictive maintenance alerting reach the instrument cluster display?
Predictive maintenance alerts originate in the fleet management cloud backend, where machine learning models process historical sensor data streams from connected vehicles. When a model detects an anomalous parameter trend, it generates an alert that is transmitted through the telematics control unit to the vehicle’s CAN bus. The instrument cluster reads this as a structured message and renders it as a maintenance advisory on screen.
Q6: Where can I find commercial truck instrument clusters with real time diagnostic and driver coaching capability?
Indication Instruments offers instrument cluster and digital display solutions with J1939 integration, real time DTC display, and telematics connectivity suited to commercial truck applications. Contact the team for an application-specific consultation.
Related Articles
- The Role of Instrument Clusters in Connected Vehicle Ecosystems and Telematics Integration
- Advanced Digital Instrument Clusters for Heavy Duty Trucks and Industrial Vehicles
- CAN Bus Integration in Digital Displays: How It Improves Vehicle Performance
- The Importance of Sensor Integration in Modern Vehicle Instrument Clusters
- How Fleet Operators Are Using Predictive Maintenance to Cut Downtime by 30 Percent
")

")